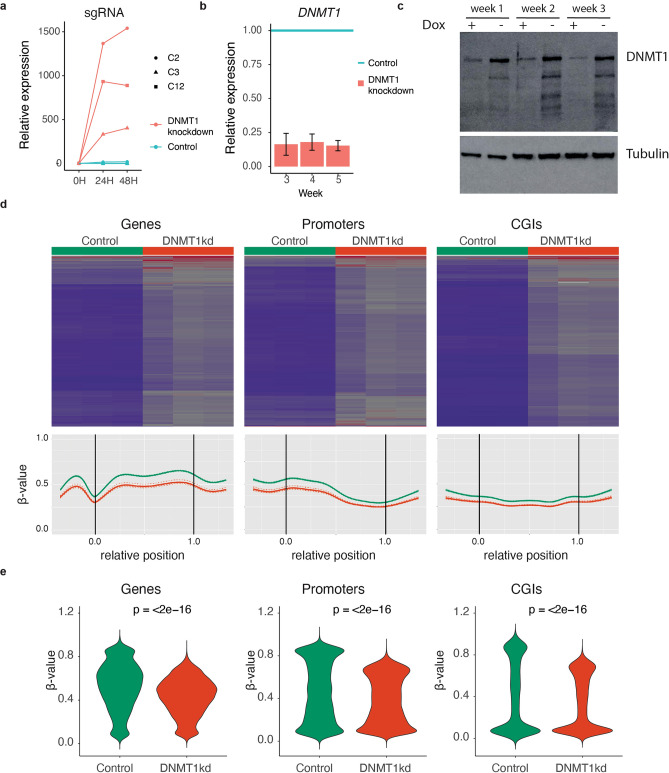
Figure 1.
Characterization of DNMT1 knockdown cells (a) Relative increase in doxycycline-inducible sgRNA expression upon 24 h and 48 h hours of treatment with doxycycline. (b) Relative DNMT1 expression levels upon doxycycline treatment of DNMT1 knockdown cells. n = 4 per time point. (c) Western blot images of DNMT1 protein expression levels upon prolonged doxycycline treatment of DNMT1 knockdown cells for the indicated time points. (d) EPIC DNA methylation array analysis of DNMT1 knockdown cells cultured with or without doxycycline for 6 weeks. Top panels: heatmaps with methylation values for control (n = 3) and DNMT1 knockdown (n = 3) cells. Lower panels: Regional methylation profiles (composite plots) according to sample groups. DNMT1 knockdown cells consistently show reduced methylation density represented by lower β-values. For each region in the corresponding region type, relative coordinates of 0 and 1 correspond to the start and end coordinates of that region respectively. Coordinates smaller than 0 and greater than 1 denote flanking regions normalized by region length. Horizontal lines indicate region boundaries. (e) Violin plots of the β-values for genes, promoters and CGIs. Statistical test: paired Wilcoxon signed-rank test.

