Figure 2.
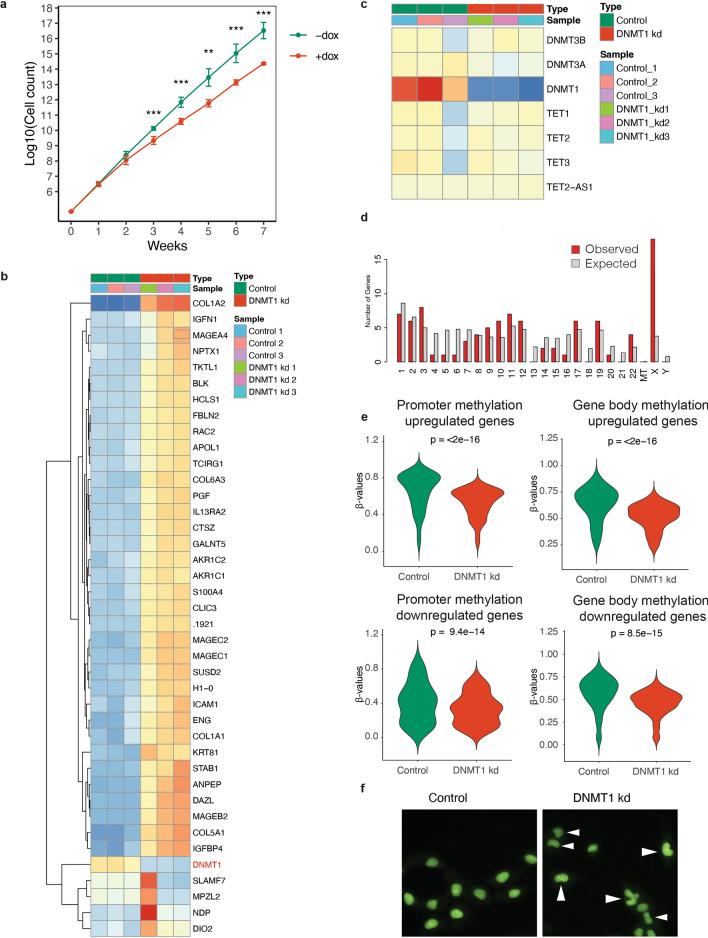
Phenotype of DNMT1 knockdown cells (a) Growth curves of doxycycline induced DNMT1 knockdown cells and control cells (n = 4 per condition per time-point). (b) Unsupervised hierarchical clustering heatmap of the 40 most differentially expressed genes between doxycycline induced DNMT1 knockdown cells and control cells. (c) heatmap of the expression of the writers (DNMT genes) and erasers (TET enzymes) of DNA methylation in doxycycline induced DNMT1 knockdown cells and control cells. (d) Distribution of genes on chromosomes as determined by ShinyGO 0.7681. Chi-square test p = 5.8E-08. (e) Violin plots of the β-values for genes, promoters and CGIs for the differentially expressed genes (p adj < 0.05). Statistical test: paired Wilcoxon signed-rank test.(f) Morphology of control cells and cells with hypomethylated genomes. Arrowheads denote cells with abnormal nuclear morphology.

