Figure 3.
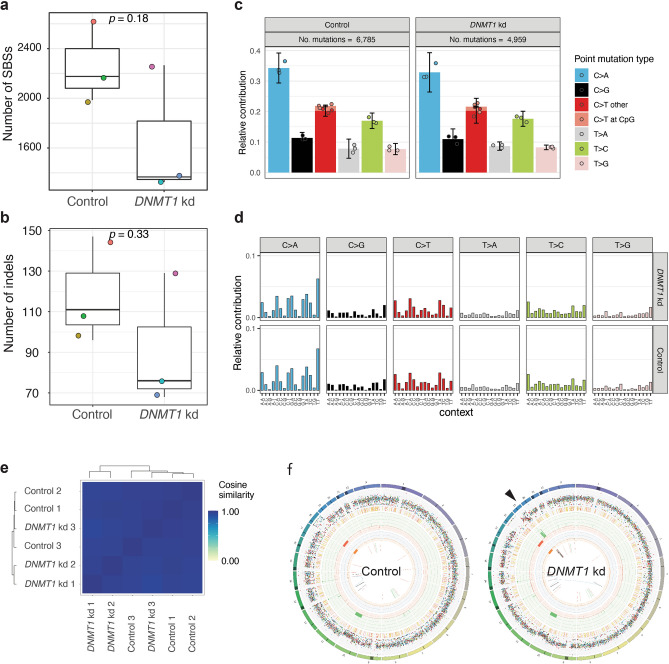
Mutational impact of global DNA methylation loss (a) Box-plot with the individual data points of the number of single base substitutions per clone. Each clone is represented by a unique color. (b) Box-plot with the individual data points of the number of indels per clone. Each clone is represented by a unique color. Same color scheme as in a. (c) Average mutational spectra of (left) control clones and (right) hypomethylated DNMT1 knockdown clones. (d) Average mutational profiles of (top) hypomethylated DNMT1 knockdown clones and (bottom) control clones. (e) Cosine similarity between the mutational profiles of hypomethylated DNMT1 knockdown clones and control cells. (f) Circos plots from a clone with (left) normal DNA methylation levels and (right) a hypomethylated DNMT1 knockdown clone. Arrowhead denotes a chromothripsis event at the q-arm of chromosome 19, which was observed in 2 out of 3 clones.

