Figure 4.
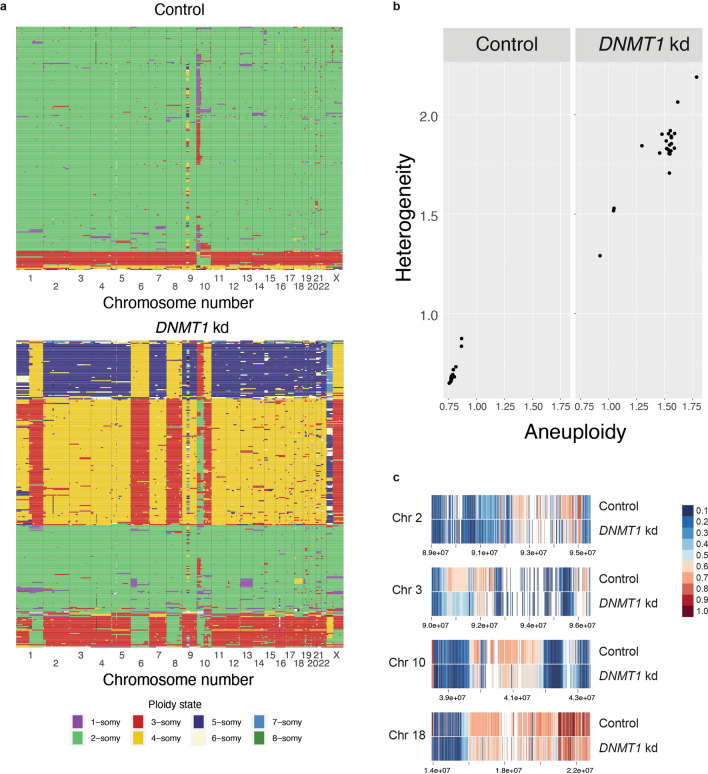
Impact of global DNA methylation loss on chromosomal instability (a) Single cell DNA sequencing results showing the copy number state per chromosome per cell for (top) control clones and (bottom) hypomethylated DNMT1 knockdown clones. Each row represents a single cell and each column represents a chromosome. For each condition 384 cells were sorted. Shown are the cells with good quality libraries. (b) Aneuploidy and heterogeneity scores for (left) control clones and (right) hypomethylated DNMT1 knockdown clones calculated with Aneufinder. Each dot represents a chromosome. (c) Reduced DNA methylation levels in pericentromeric regions of chromosomes 2, 3, 10, and 18 upon DNMT1 knockdown as determined by Nanopore DNA sequencing. Coordinate values are indicated.

