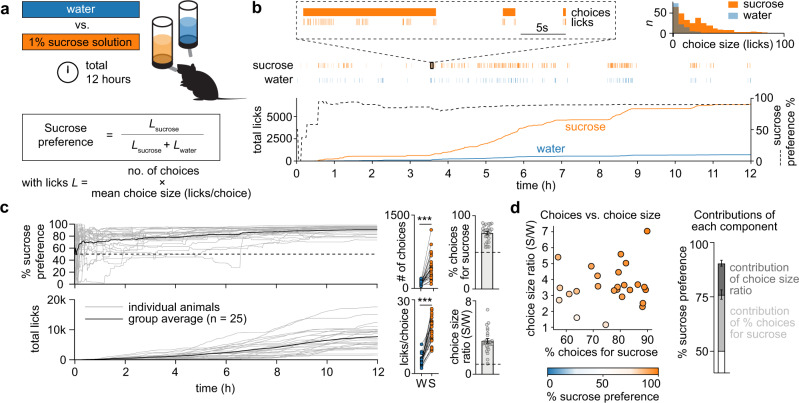
Fig. 1. A microstructure analysis of licking behavior in the sucrose preference test.
a Experimental overview of the sucrose preference test (SPT). A mouse is placed for 12 h in an operant chamber that includes a lickometer attached to two bottles that contained either water (blue) or 1% sucrose in water (orange). Sucrose preference was defined as the number of licks for sucrose as a fraction of the total number of licks. b Sample session showing the consumption of sucrose (orange) compared to water (blue). Inset in the upper right corner shows a histogram of the number of choices for sucrose and water as a function of the number of licks within such choice; choices were separated by a pause in licking of at least 5 s. c Left: Sucrose preference and total licks over time for the entire group (n = 25 mice, male and female). Right: Calculation of the % of choices for sucrose and choice size ratio (sucrose (S)/water (W)) for all animals. Dashed lines indicate indifference point (i.e., 50% for choices for sucrose and 1 for choice size ratio). Error bars indicate mean ± SEM. Source data are provided as a Source Data file. d Scatter plot showing sucrose preference (color coded) as a function of both the % of choices for sucrose and the choice size ratio (n = 25 mice, male and female). Bar graphs in the right panel show the contribution of the % of choices for sucrose and the choice size ratio to the % sucrose preference (i.e., the conventional measure of the SPT). Error bars indicate mean ± SEM. Source data are provided as a Source Data file.

