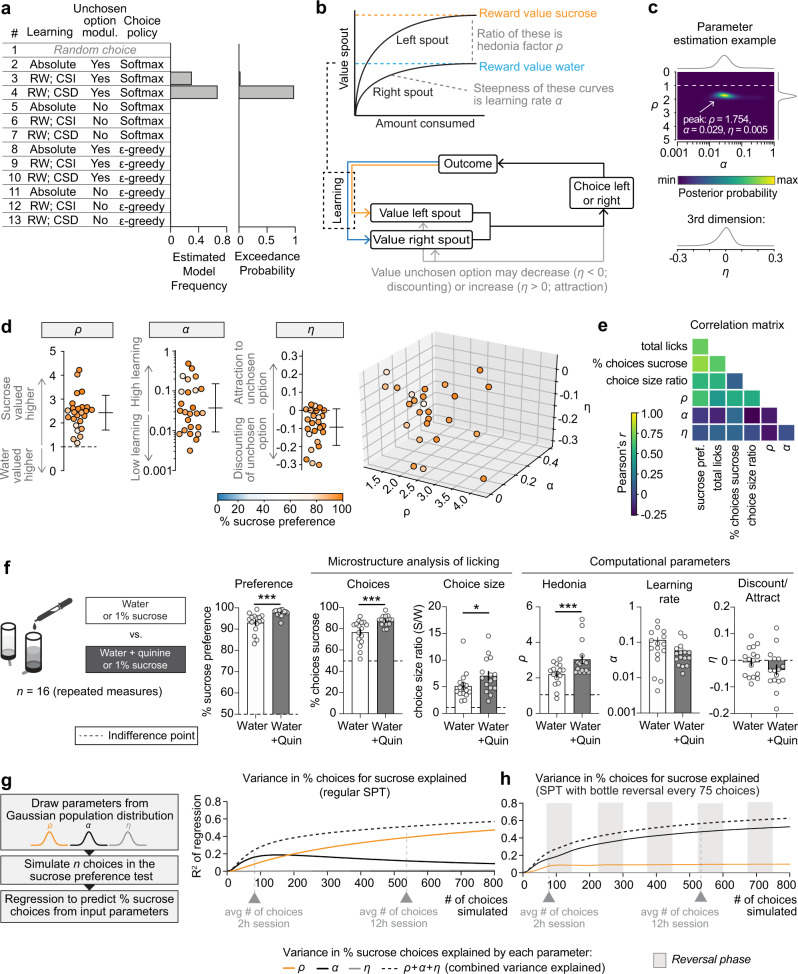
Fig. 2. A computational model for the sucrose preference test.
a Bayesian model selection was performed on the trial-by-trial choice data of the SPT, in which 12 different reinforcement learning models (and a null model) were fit to individual sessions. Abbreviations: RW, Rescorla-Wagner; CSI, choice-size independent learning rule (learning is equal for every choice, independent of how many licks were made); CSD, choice-size dependent learning rule (i.e., learning is stronger when more licks were made in a choice). The exceedance probability measures how likely it is that a given model is more frequent than the other models (see “Methods”). b Depiction of ‘selected model’ (model #4 shown in panel (a)): Mice assess the value of both bottles by gradual learning through learning rate α. Hedonia parameter ρ is the ratio of the absolute value of sucrose to the absolute value of water (>1 is higher value for sucrose, <1 higher value for water). Discounting/attraction parameter η indicates the extent to which the value of the unchosen bottle decreases (η < 0; discounting) or increases (η > 0; attraction) after every choice. c Likelihood landscape of the selected model for the sample session shown in Fig. 1b. Color indicates posterior probability; ‘peak’ in this 3-dimensional matrix is composed of the ‘best-fit’ model parameters. See also Supplementary Movie 1. d Best-fit model parameters for the entire cohort shown in Fig. 1 (n = 25 mice). Colors indicate the % sucrose preference for each mouse. Dashed lines indicate indifference point; error bars indicate mean ± SD. e Correlation matrix showing conventional and computational measures of the SPT. f Adulterating water with 250 µM quinine hemisulphate elevates the value of hedonia parameter ρ, in accordance with a larger relative value difference between water and sucrose. Repeated measures in n = 16 mice; ***p < 0.001, **p < 0.01 in paired t-test or Wilcoxon matched pairs signed rank test. Dashed line indicates indifference point; error bars indicate mean ± SEM; ***p < 0.001, **p < 0.01; see Supplementary Table 1 for statistical details. Source data are provided as a Source Data file. g Variance explained in the % of choices for sucrose in simulated data (based on the variability observed in the group of mice shown in Fig. 2d) for different lengths of the SPT. h Same analysis as in panel (g), but for SPT with bottle switches. This increases the contribution of learning rate α to the % of choices for sucrose, while reducing the contribution of hedonia parameter ρ.

