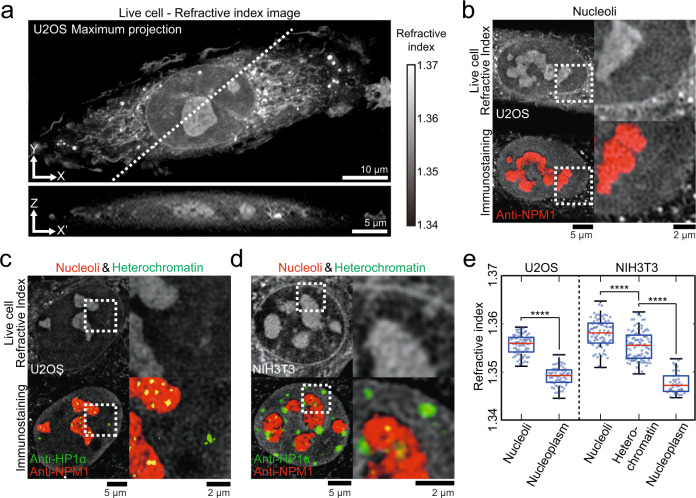
Fig. 1. Quantitative refractive index imaging of intracellular condensates.
a (Top) Maximum intensity projection of the 3D RI tomogram of an intact live U2OS cell. (Bottom) Cross-sectional view of the same cell along a white dashed line. b–d (Top row) RI images of intact live cells. (Bottom row) Combined RI and immunofluorescence images of the same cell after fixation. The dashed boxes indicate areas for zoomed-in images on the right. b RI images of an intact live U2OS cell and the same cell after immunostaining with anti-NPM1. c RI images of an intact live U2OS cell and the same cell after double-immunostaining with anti-NPM1 and anti-HP1α. d RI images of an intact live NIH3T3 cell and the same cell after double-immunostaining with anti-NPM1 and anti-HP1α. e Quantification of refractive indices of intracellular regions in intact live cells. Data: center line = mean; box limits = [Q1, Q3]; whiskers = [Max, Min]; n = 73 (U2OS Nucleoli), 62 (U2OS Nucleoplasm), 79 (NIH3T3 Nucleoli), 98 (NIH3T3 Heterochromatin) and 42 (NIH3T3 Nucleoplasm). Distributions were statistically compared using the two-sided unpaired t-test. p = 1.83 · 10−39; p = 9.63 · 10−8; p = 5.03 · 10−32; ****p < 0.0001. Refractive index images are adjusted to the range of refractive index 1.34–1.37 for (a) and (d) and 1.337–1.37 for (b) and (c).

