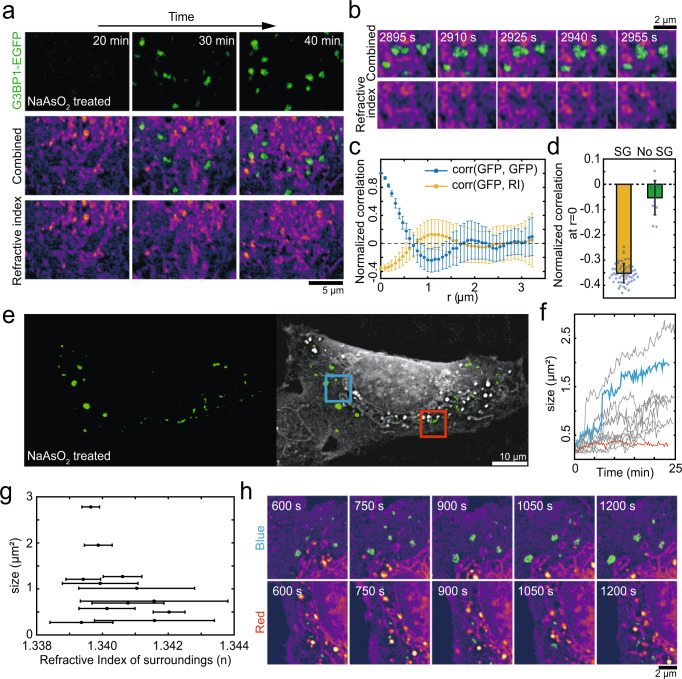
Fig. 5. Intracellular structures influence the distribution, morphology and growth of condensates.
a Time-lapse images of stress granule formation within the G3BP1-EGFP expressing U2OS cell after the treatment of 500 μM sodium arsenite. b Zoomed-in images of the same cell in (a). c Normalized 2D autocorrelation of G3BP1-EGFP images and cross-correlation between G3BP1 and RI images. Plotted are the average (filled circles) and standard deviation (errorbars) of the correlation, at each binned radial shift (n = 11). d For zero radial shift, normalized cross-correlation values between G3BP1 and RI images are plotted in the presence and absence of stress granules. n = 55 (with stress granule) and 11 (no stress granule). Error bar was defined as standard deviation. e Combined RI and fluorescence images of a live G3BP1-EGFP expressing U2OS cell one hour after treatment of 500 μM sodium arsenite. Blue and red boxes represent two ROIs in (h). f Temporal changes of the size of individual stress granules. Granules with color codes are those found in the corresponding ROIs in I. Data from 12 stress granules were shown. g The size of individual stress granules at the last time point is plotted against the mean RI values of areas surrounding each granule. RIs within 5 pixels, 385 nm, from each granule are used to compute the mean and the standard deviation (errorbar) of the surroundings. Data from 12 stress granules were shown. h Time-lapse images for stress granule growth in two different ROIs. (Top) the blue box ROI in (e). (Bottom) the red box ROI in (e). All refractive index images are adjusted to 1.337–1.37.

