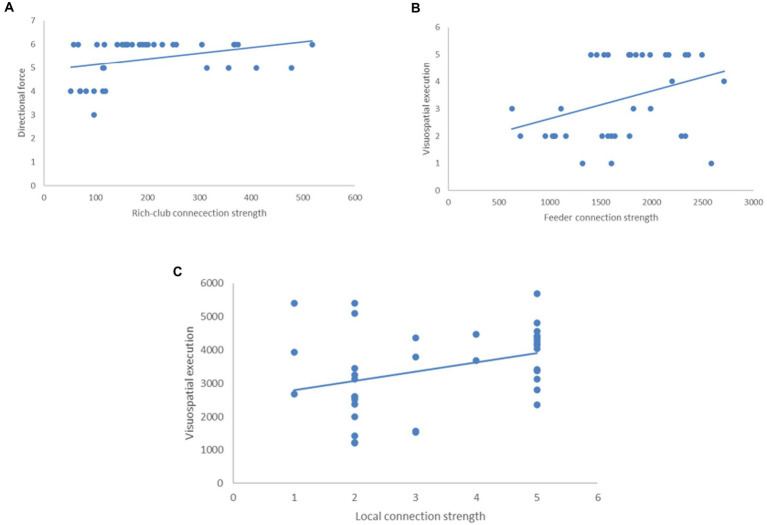
Figure 6.
The relationship between connectivity of brain network and MoCA scale in the CHF + CI group. (A) The rich-club connection strength was related to the orientation (direction force; p = 0.043). (B) The feeder connection strength was related to Visuospatial/Executive function (p = 0.032). (C) The local connection strength was related to Visuospatial/Executive function (p = 0.032, B; p = 0.038).

