
Figure 4.
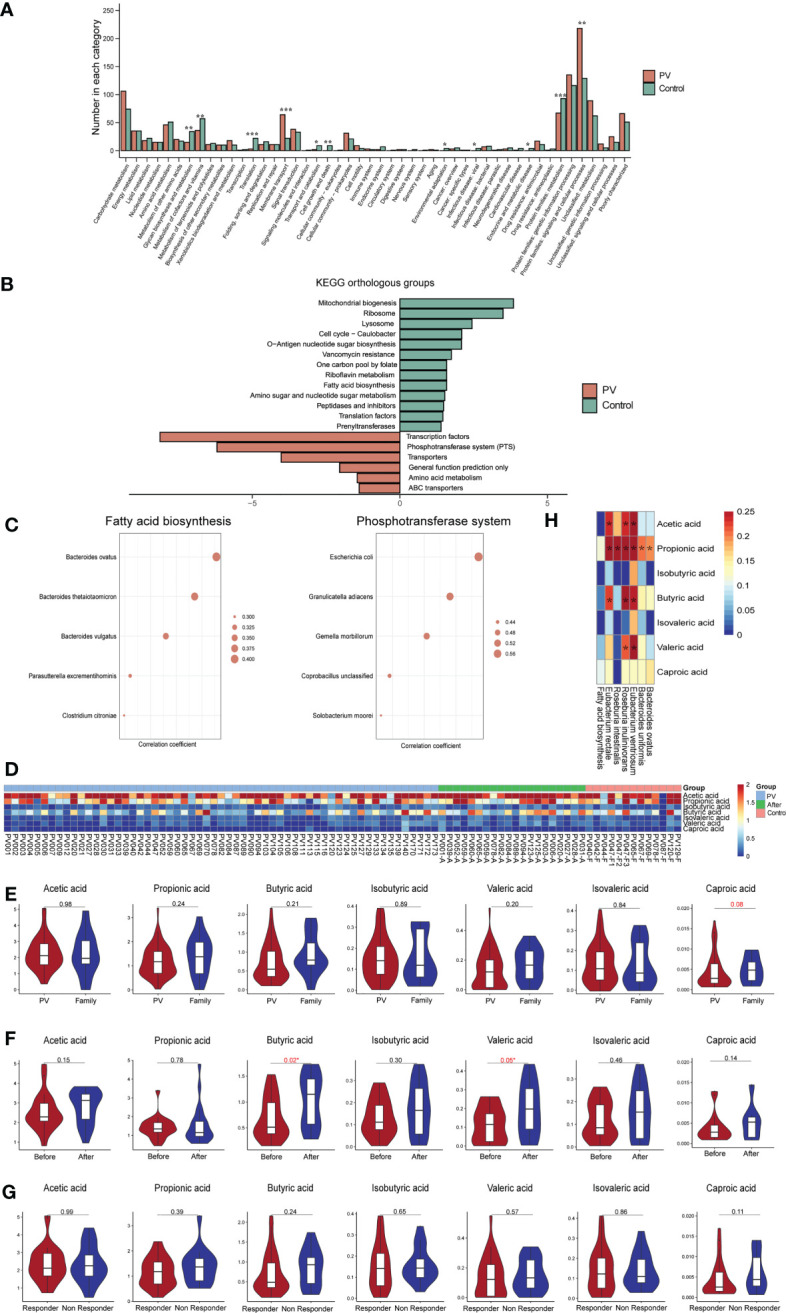
Functional changes in the gut microbiome. (A) Level B differential KEGG pathways, horizontal coordinates represent pathway names, vertical coordinates represent the number of differential KOs involved in each pathway (*represents a P value less than 0.05, **represents a P value less than 0.005, ***represents a P value less than 0.0005); (B) C-level difference KEGG pathway between PV patients and healthy controls, horizontal coordinate represents the P value of -log10; (C) The top five microbial species with the strongest association with fatty acid biosynthesis and phosphotransferase system pathways; (D) Heatmap of short fatty acids contents in each sample; (E–G) SCFA levels in the (E) PV and healthy control groups, (F) pre-treatment and post-treatment groups, and (G) responder and non-responder groups; (H) Heatmap of correlation coefficients between healthy control-enriched probiotics and SCFA levels; The *means the P value is less than 0.05 using Spearman’s correlation analysis. PV, pemphigus vulgaris; KEGG, Kyoto encyclopedia of genes and genomes; KO, KEGG Orthology; SCFA, short chain fatty acid.