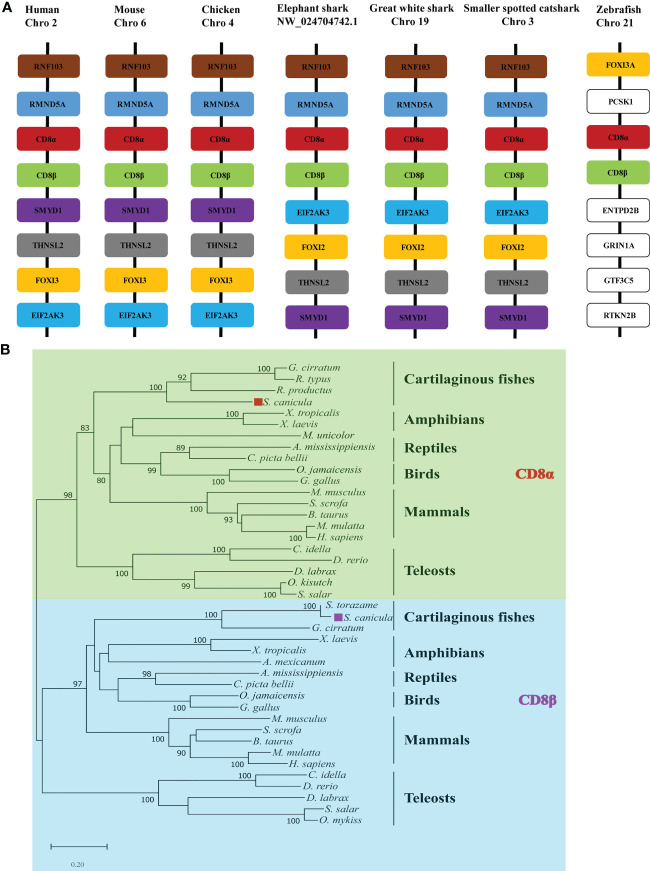
Figure 1.
Analysis of ScCD8 genes. (A) Gene synteny analysis of CD8α, the synteny information for human, mouse, chicken, elephant shark, great white shark, zebrafish and small-spotted catshark, and spotted gar genes were obtained from the Ensembl database. (B) Neighbor-joining (N-J) phylogenetic tree of CD8 genes. The tree was constructed using the N-J method within the MEGA-X program with bootstrap values shown next to the branches based on 10,000 bootstrap replications. “◼” indicates ScCD8α (red) and ScCD8β (purple). The accession numbers of protein sequences are provided in Supplementary Table 1 .

