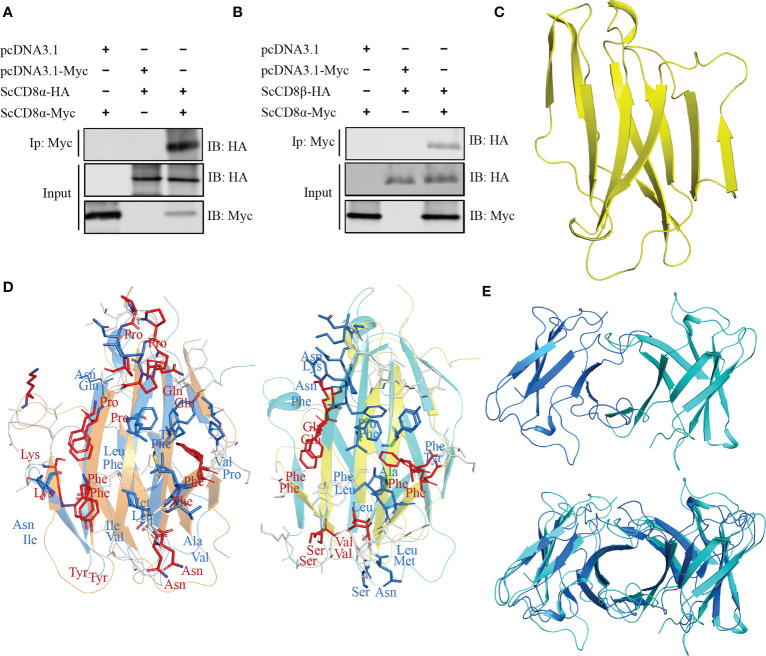
Figure 6.
Interaction and modelling and of ScCD8α and ScCD8β. (A, B) Interaction of ScCD8α with ScCD8α (A) and ScCD8β (B). HEK293 cells were co-transfected with the indicated expression plasmids (5 μg each). After 24h, cell lysates were immunoprecipitated (IP) with α-Myc Ab conjugated agarose beads, and immunoblotted (IB) was detected with α-Myc or α-HA Abs. (C) Model of ScCD8β shown as a cartoon structure. (D) Predicted interface of CD8αβ with the ScCD8α monomer shown in marine, ScCD8β in cyan, mouse CD8α in orange, and CD8β in yellow. The side chains of key residues forming the CD8αβ interface are shown as sticks. Conserved residues are colored red, physiochemically-conserved residues are colored marine, other residues are shown in white. (E) The structural model of ScCD8αβ (top) and shown structurally aligned with ScCD8αα (bottom). ScCD8α is colored marine and ScCD8β cyan.

