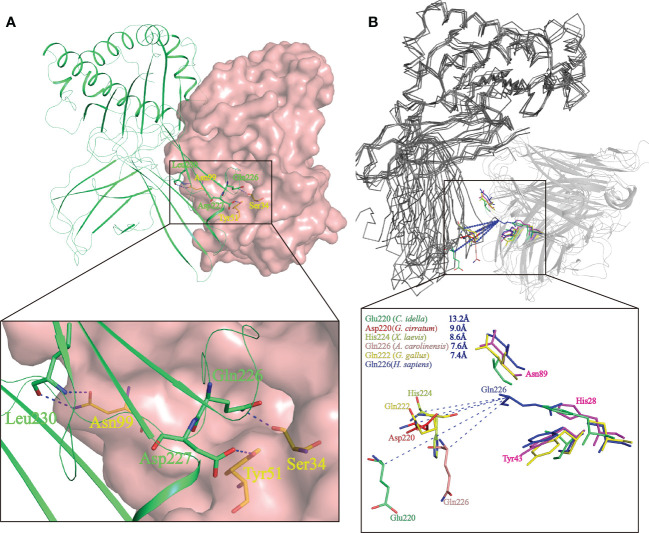
Figure 8.
Prediction of the key intermolecular forces maintaining the interaction between ScCD8αα and p/MHC I molecules. (A) The interaction between human CD8αα and p/MHC I Human MHC is shown as a lime green cartoon structure while the surface of human CD8αα is rendered in pink. The key amino acid side chains of the interaction between CD8αα (yellow) and p/MHC I (green) are shown. Key hydrogen bonds at the interface of human CD8αα and p/MHC I (PDB ID: 1AKJ) are indicated by blue dashed lines. (B) The shift distance between the CD loops reveals a different binding mode of CD8 in non-mammals. The MHC I molecules are shown as gray ribbons and the CD8αα structure as cartoon with a transparency of 50%. The shift distance is indicated by blue dash lines. Key residues in the CD loop of MHC I and the corresponding residues interacting with the CD8αα molecules are shown as sticks. Residues of MHC I and CD8αα of grass carp (limegreen), nurse shark (red), African clawed frog (limon), chicken (yellow) and human (blue) are colored.

