Figure 5.
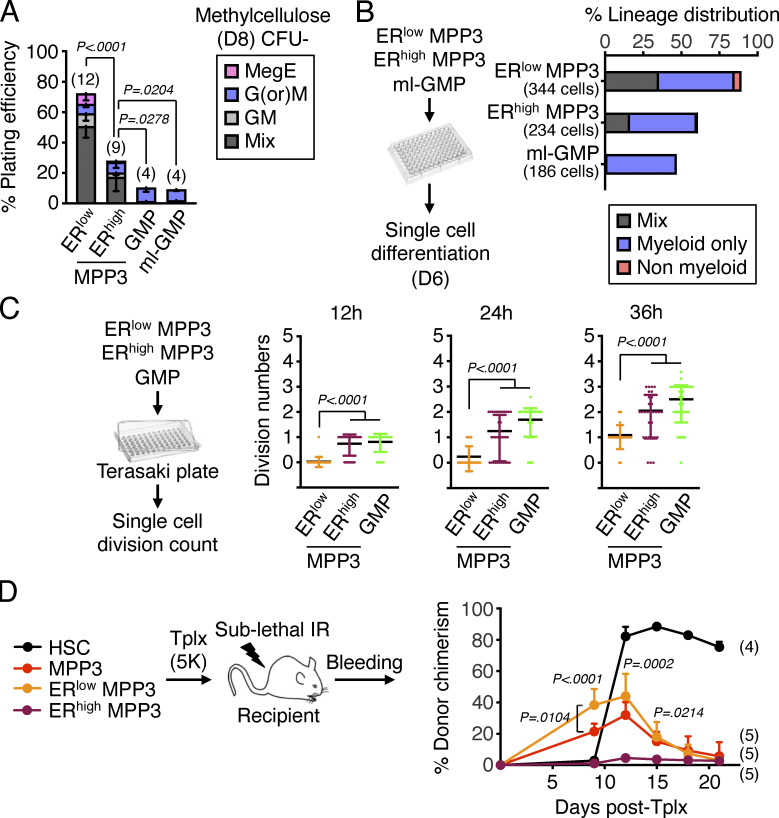
Functional characterization of MPP3 subsets. (A) Myeloid differentiation of ERlow MPP3, ERhigh MPP3, GMP, and ml-GMP in methylcellulose assays. Results were scored after 8 d (D8) in three independent experiments. Mix, mixture of all lineages; GM, granulocyte/macrophage; G(or)M, granulocyte or macrophage; MegE, megakaryocyte/erythrocyte. (B) Single cell in vitro lineage differentiation assay of ERhigh/ERlow MPP3 subsets and ml-GMP with flow cytometry identification after 6 d (D6) in culture. A total of 384 single cells were assessed in four independent experiments with data expressed as a percentage of mix, myeloid only, and non-myeloid lineage output. Myeloid only, CD45+/Mac-1+/Gr-1+ myeloid cells; Non-myeloid, combination of CD45+/Mac-1−/Gr-1−/CD41+/CD61+ and manually counted megakaryocytes, CD45+/Mac-1−/Gr-1−/CD41−/CD61+/CD71+ erythroid cells and CD45+/Mac-1−/Gr-1−/CD41−/CD71−/FcεRI+ mast cells; Mix, both myeloid and non-myeloid output. (C) Single-cell in vitro division assay of ERhigh/ERlow MPP3 subsets and GMPs in Terasaki plates with an assessment of cell division after 12–36 h in culture. A total of 160 single cells were assessed in three independent experiments with data expressed as a scatter dot plot (bar, mean). (D) Short-term in vivo lineage tracing assay with the experimental scheme for the transplantation (tplx) of 5,000 cells into each sub-lethally irradiated (IR) recipient, and quantification of donor chimerism in PB over time. Significance was calculated between mice transplanted with ERlow or ERhigh MPP3 unless otherwise indicated. Data are means ± SD, and significance was assessed by a two-tailed unpaired Student’s t test.

