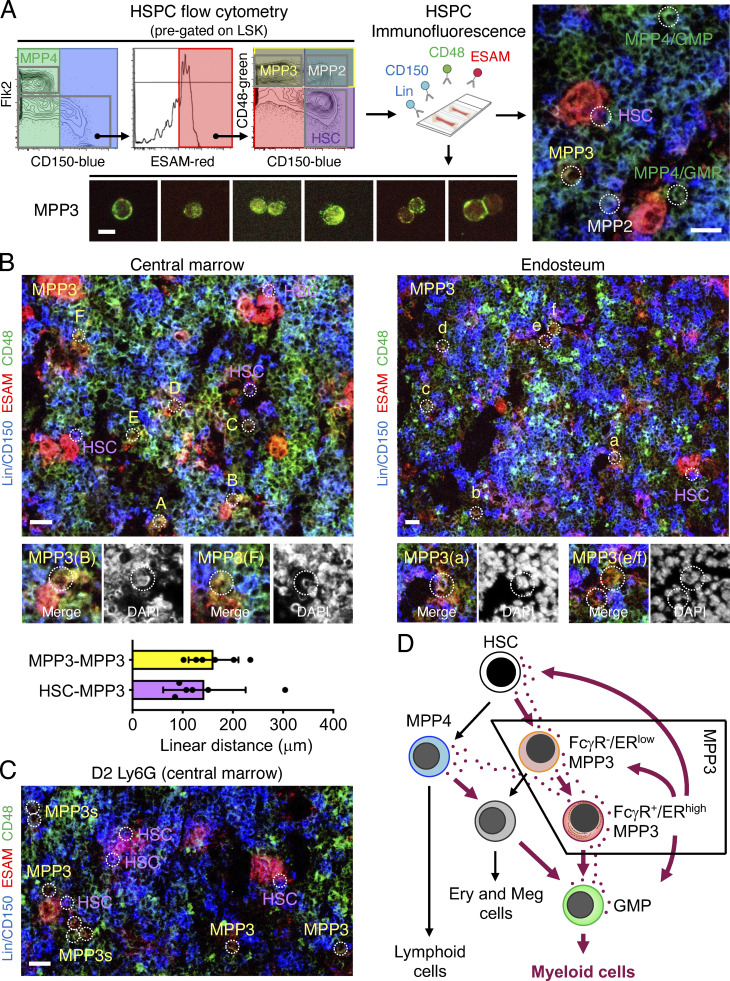
Figure 8.
MPP3 are localized in the vicinity of other HSPCs in the BM cavity. (A) Immunofluorescence staining strategy to identify HSPC populations in situ on bone sections with flow cytometry showing the simplified three-color staining scheme used (left), representative examples of stained MPP3 isolated by flow cytometry (bottom; scale bar, 10 µm), and a representative example of stained BM section (right; scale bar, 20 µm). Populations are indicated by white dotted line circles, and while HSC (purple), MPP2 (white), MPP3 (yellow) can be distinguished from the rest of the BM (blue) and megakaryocytes/megakaryocytic lineage (red) cells. MPP4 (green) are largely overlapping with GMPs in this staining scheme. Also, note the relatively spotty CD48 surface expression on MPP3. (B) Representative images of in situ immunofluorescence staining of HSPCs in the central marrow cavity (left) and at the endosteum (right), and quantification of linear distance between the indicated populations (bottom, 30 MPP3/MPP3 and 34 HSC/MPP3 pairs were counted in six independent experiments). MPP3 (yellow) are indicated by white dotted line circles, with magnified images of the indicated cells shown below with DAPI counterstain. HSCs (purple) are also denoted at both locations. Scale bar, 20 μm. (C) Representative image of in situ immunofluorescence staining of HSPCs in the central marrow cavity of anti-Ly6G antibody-treated mice at 2 d (D2) after injection showing the expansion and closest proximity of MPP3 with HSCs (white dotted line circles) in regenerative conditions. Scale bar, 20 μm. (D) Model depicting myeloid differentiation trajectories in early hematopoietic hierarchy and the role of secretory FcγR+/ERhigh MPP3 subset in amplifying HSPC myeloid commitment through autocrine/paracrine regulation in the BM microenvironment. Ery, erythrocytes; Meg, megakaryocytes.

