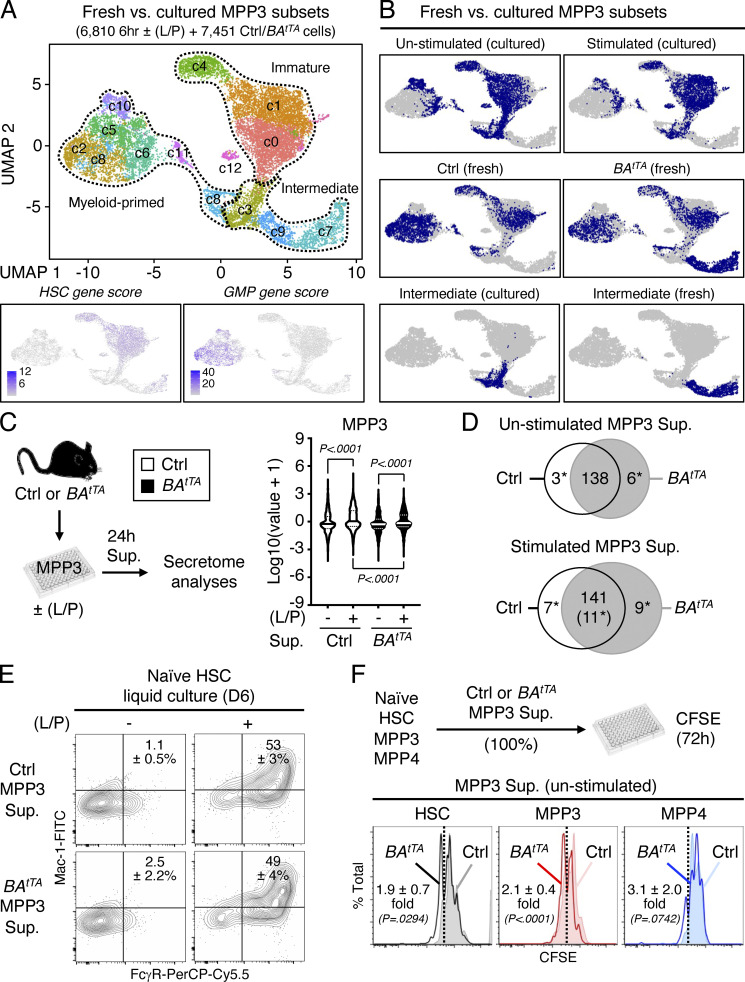
Figure S4.
Molecular rewiring and constitutive cytokine secretion of leukemic MPP3. (A and B) Comparison of freshly isolated and cultured MPP3 with (A) UMAP of harmonized unstimulated/stimulated MPP3 and freshly isolated Ctrl/BAtTA MPP3 scRNA-seq datasets with gene module scoring for HSC and GMP genes (bottom) and (B) single projection of each dataset and specific metabolic intermediate clusters. (C and D) Secretome analyses of unstimulated/stimulated Ctrl and BAtTA MPP3 supernatants (Sup.) with (C) experimental scheme and violin plots of secreted cytokine intensity (four independent experiments; bar, median; dotted line, quartiles), and (D) Venn diagrams showing similarly and differentially secreted cytokines (*, significant change). Supernatants were collected upon the culture of 10,000 Ctrl or BAtTA MPP3 for 24 h in 150 µl base media ± LPS/Pam3CSK4 (L/P) stimulation. The full list of differentially secreted cytokines is provided in Table S5. (E) Differentiation of naïve HSCs in Ctrl and BAtTA MPP3 supernatants analyzed after 6 d (D) of liquid culture for myeloid cell markers. Representative FACS plots and quantification of Mac-1+/FcγR+ frequencies are shown (three independent experiments). (F) Effect of unstimulated Ctrl and BAtTA MPP3 supernatants on naïve HSCs, MPP3, and MPP4 proliferation analyzed by CFSE dilution assay after 72 h in culture. Experimental scheme and representative FACS plots are shown. Dotted lines identify CSFElow fast proliferative cells, and results indicate the proproliferative effect of BAtTA MPP3 supernatant shown as fold change compared with Ctrl MPP3 supernatant (four independent experiments for HSC and MPP4, five independent experiments for MPP3). Data are means ± SD, and significance was assessed by a two-tailed unpaired Student’s t test.

