Figure 3.
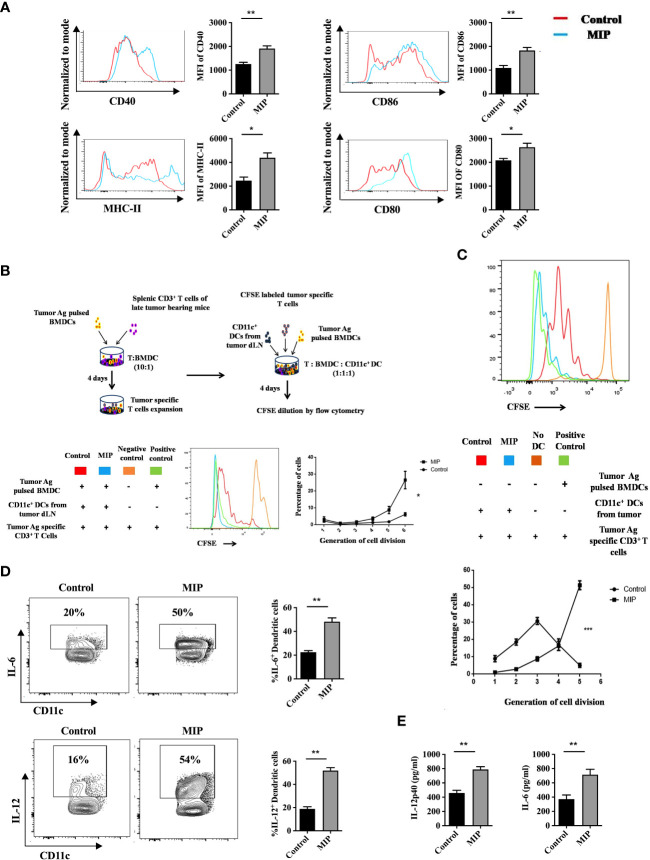
Phenotypic and functional analysis of tumor infiltrating CD11c+ dendritic cells: (A) Flow cytometric analysis of activation and maturation markers on Ti-DCs including CD80, CD86, MHC-II and CD40. Representative histogram plots indicate MFI of each activation marker in one mouse per group (n=5). (B) Ex-vivo DC suppression assay: (Top) Tumor-specific CD3+ T cells were obtained as depicted in the flow chart. After CFSE labeling, they were added to culture wells containing tumor pulsed BMDCs (1:1). Sorted CD11c+ DCs (TI-DC) either from Control or MIP treated tumor was added to these cultures making a 1:1:1 ratio (T cell/pulsed BMDC/sorted DC). (Bottom) The histogram plot is a representative of CFSE dye dilution which indicates tumor specific T cell proliferation of one mouse per group (proliferation induced by tumor pulsed BMDCs in the presence of Ti-DCs). The line graph represents percentage of tumor specific T cells in each generation of cell division (n = 5 mice/group). For the line graph, statistical significance was determined by two-way ANOVA. (C) TI-DC mediated T cell proliferation assay: CFSE labeled tumor-specific CD3+ T cells were co-cultured with CD11c+ DCs sorted either from Control or MIP treated tumor tissue (T cell: TI-DC ~ 10: 1). The line graph represents percentage of tumor specific T cells in each generation of cell division (n = 5 mice/group). For the line graph, statistical significance was determined by two-way ANOVA. (***:p=0.0001 ; *:p<0.05). (D) Single-cell suspensions from tumors were stained for CD11c, IL-12 and IL-6; Percent frequency of IL-12 and IL-6 on Ti-DCs were evaluated by flow cytometry. Representative contour plot showing the frequency of IL-12+ and IL-6+ DCs in one mouse per group. (E) In a tumor antigen recall response, IL-12 and IL-6 level was determined (by ELISA) in total leukocytes from tumor draining lymph nodes of control/MIP treated mice. All findings that are shown as bar graphs represent the mean ± SEM of five mice per group in one experiment. Statistical significance was determined by unpaired non-parametric students t-test (*:p<0.05, **:p<0.01, ns, non-significant). For all experiments, two independent repeats were done.

