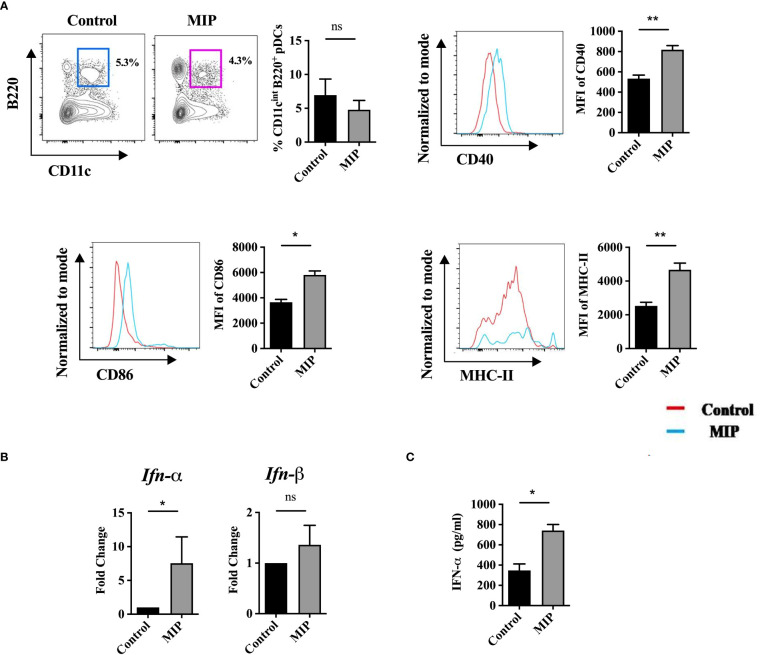
Figure 4.
Infiltration of pDCs in B16 tumors and effect of MIP treatment on their phenotype and function: (A) Flow cytometric analysis of infiltration, activation and maturation of tumor infiltrating pDCs (n=5). The contour plot is representative image of frequency of pDCs in one mouse per group. Representative histogram plots show MFI of each activation marker in one mouse per group. (B) mRNA expression of type 1 IFNs on total tumor infiltrating leukocytes (n=4). (C) 106 total leukocytes from tumor draining lymph node were seeded and cultured in complete RPMI for 48 hours in presence of B16 tumor lysate. Level of IFN-α from the supernatants was determined by ELISA (n=5). The results are expressed as mean ± SEM of one experiment. Statistical analysis was performed using unpaired Student’s t test (*:p<0.05, **:p<0.01, ns, non-significant). Two independent experimental repeats were done.

