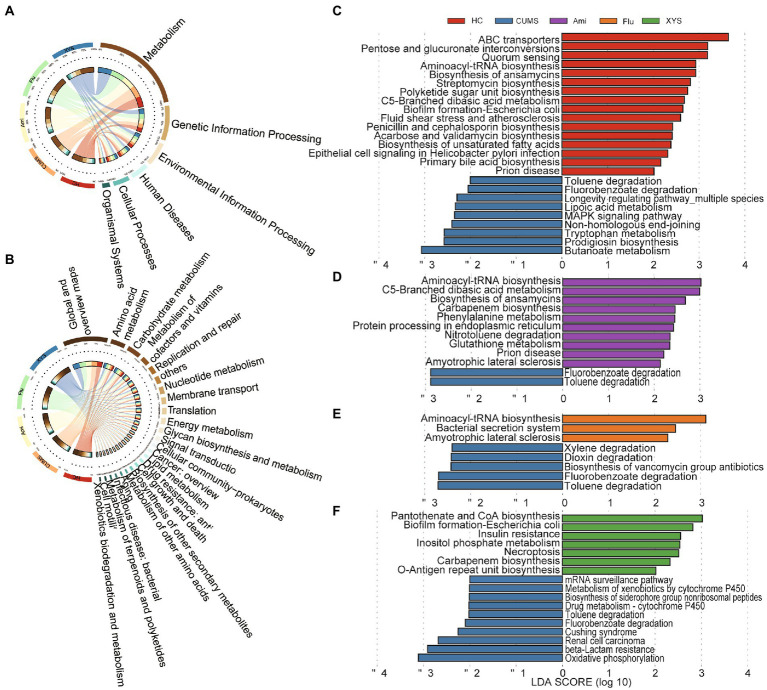
Figure 3.
The functional profiles of gut virome in the KEGG pathway via metagenomics sequencing. Distribution of KEGG pathways at (A) level 1 and (B) level 2. LEfSe analysis of the KEGG pathways with the criteria of LDA > 2.0. (C) Comparison between the HC and CUMS on the level 3 of KEGG pathways. (D) Comparison between the CUMS and Ami on the level 3 of KEGG pathways. (E) Comparison between the CUMS and Flu on the level 3 of KEGG pathways. (F) Comparison between the CUMS and XYS on the level 3 of KEGG pathways.

