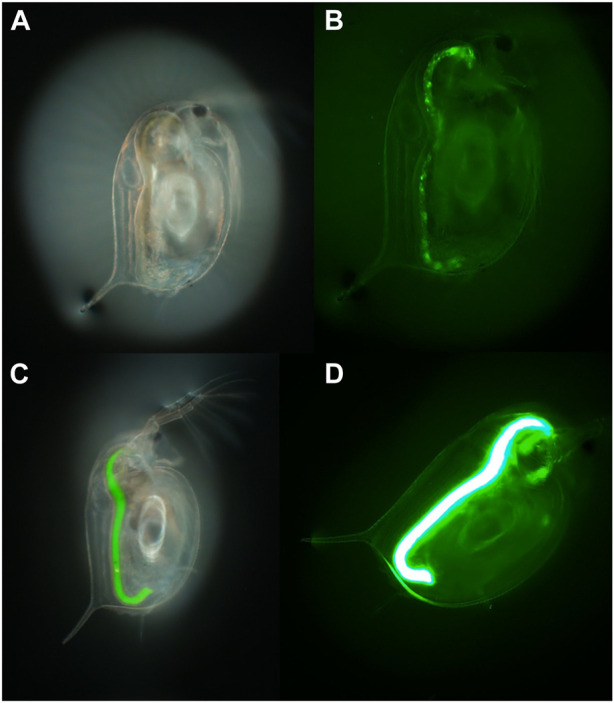
FIGURE 2.

An example of the use of fluorescence to determine uptake of 1–5 µm polyethylene MP particles by D. magna visualised in two daphnids exposed to different concentrations of the MPs (50 and 500 mg/L, respectively) for 24 h. (A,C) brightfield, and (B,D) fluorescence imaging of the first and second daphnids, respectively. Taken with an Olympus optical microscope with a Green Fluorescent Protein (GFP) filter cube and dichroic mirror and a DP74 colour camera and viewed using CellSens software (×70 magnification).
