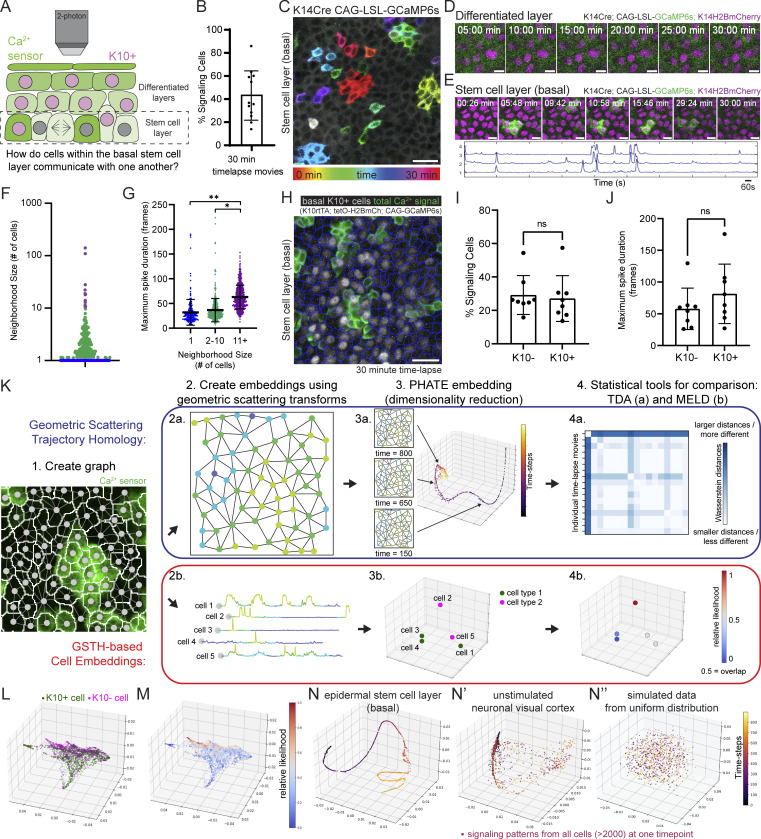
Figure 1.
The epidermal stem cell layer cohesively carries out coordinated Ca2+ signaling at long range. (A) Schematic of intravital imaging of Ca2+-sensor mice. (B) Percent of epidermal basal cells spiking at least once during 30-min recording of Ca2+ signaling in a live mouse. n = 12 movies from six mice. (C) Max intensity projection of GCaMP6s signal from 30-min recording of the stem cell layer, showing a diversity of signaling patterns. Color scale indicates GCaMP6s signal across time. Scale bar: 25 µm. (D) Lack of Ca2+ signaling in the differentiated spinous layer over 30 min. Scale bars: 10 µm. (E) Region of the stem cell layer where a cluster of three cells spikes repeatedly over 30 min. Normalized fluorescence intensity plotted across time for each spiking cell is below. Scale bars: 10 µm. (F) Neighborhood size of cells with spatiotemporally localized Ca2+ signaling from 30-min recording of the epidermal basal stem cell layer. Purple, blue, and green dots represent the three spatial patterns. n = 6 recordings from three mice. (G) Maximal spike duration (maximal number of 2-s frames between the start and end of individual Ca2+ events) for three spatial patterns of Ca2+ signaling. *P = 0.0213, **P = 0.0056, nested one-way ANOVA, n = 6 recordings. (H) Max intensity projection of 30-min recording of the stem cell layer of Ca2+-sensor mouse with a K10 reporter. Nuclear signal in grayscale reports K10 expression and differentiation commitment. Cell segmentation is in blue and any Ca2+ activity from the 30 min is in green. Scale bar: 25 µm. (I) Percent of basal K10-reporter-positive and K10-reporter-negative cells spiking at least once during 30 min of Ca2+ signaling in a live mouse. ns = P > 0.05, unpaired two-tailed Student’s t test, n = 8 movies from five mice. (J) Maximal spike duration of Ca2+ transients in K10-reporter-positive versus K10-reporter-negative basal cells. ns = P > 0.05, unpaired two-tailed Student’s t test, n = 8 movies from five mice. (K) GSTH (a in blue) and GSTH-based Cell Embeddings (b in red) workflows. Step 1: The cellular graph is created based on spatial adjacency (nodes shown on a segmented image of stem cell layer Ca2+ signaling). Step 2: Timepoint (a) and cell (b) embeddings are created using the geometric scattering transform. Step 3: PHATE (dimensionality reduction method) visualization of time trajectory (a) or cell embeddings (b). Step 4: Statistical tools for comparison. Above: Topological data analysis—persistence diagrams and Betti curves describing the geometry of the trajectories and comparisons via Wasserstein distances. Below: Overlap of two populations is computed using MELD. (L) Representative PHATE plot of cell embeddings from K10 experiment in H. Each dot represents a single cell; its position in space represents similarity of its Ca2+ signaling to other cells’ signaling; differentiation-committed K10-reporter-positive cells are shown in green and K10-reporter-negative stem cells are shown in magenta. (M) MELD comparison of K10-reporter-positive versus K10-reporter-negative signaling patterns. Values close to 0.5 represent the most overlap between the two populations. (N–N”) Representative PHATE visualization of coordinated Ca2+ signaling in the homeostatic epithelial stem cell layer (N) versus disorganized Ca2+ signaling in the quiescent neuronal visual cortex (N’) and simulated data using a uniform distribution of values (N”).

