Figure 2.
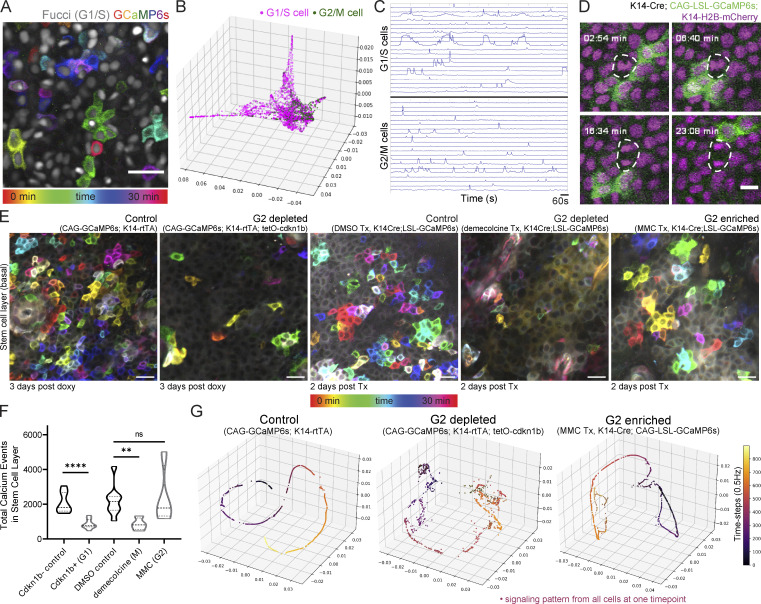
G2 cells are necessary for Ca2+ signaling activity in the stem cell layer. (A) Max intensity projection of 30-min recording of the epidermal basal layer of Ca2+-sensor mouse with a cell cycle reporter (K14-Cre; CAG-LSL-GCaMP6s; R26p-Fucci2). Only the mCherry-hCdt1 expression is visible marking G1 and S cells in grayscale. Color scale indicates GCaMP6s signal across time. Scale bar: 25 µm. (B) Representative PHATE plot of cell embeddings. Each dot represents a single cell; its position in space represents the similarity of its Ca2+ signaling pattern to other cells’ signaling; each cell/node is colored by its cell cycle state based on the thresholded Fucci signal. (C) Representative traces of Ca2+ activity (normalized GCaMP6s fluorescence intensity over time) in G1/S cells versus G2 cells. (D) Representative example of a mitotic cell with lack of Ca2+ signaling in live mice. Mitosing cells were identified via mitotic spindles via the nuclear H2B signal. Scale bar: 10 µm. (E) Representative max intensity projection of 30-min recording of the basal layer of control, G2-depleted, and G2-enriched Ca2+-sensor mice. Color scale indicates GCaMP6s signal across time. Cdkn1b mice imaged 3 d after induction. MMC- and demecolcine-treated mice imaged 2 d after treatment. Scale bar: 25 µm. (F) Total Ca2+ events identified in G2-depleted cdkn1b mice (stalled in G1), G2-enriched MMC-treated mice, and G2-depleted demecolcine-treated mice (stalled in mitosis) versus genetic or drug-treated controls. ****P < 0.0001, unpaired two-tailed Student’s t test, n = 8 control and 9 cdkn1b+ movies, **P < 0.01, one-way ANOVA, n = 8 DMSO control, 4 demecolcine, and 4 MMC movies. (G) PHATE time trajectory visualization of Ca2+ signaling in the cdkn1b+ G2-depleted basal layer and MMC-treated G2-enriched basal layer versus control basal layer. G2-depleted mice showed disruption of the smooth trajectories (representing loss of coordinated patterns of signaling), whereas the G2-enriched basal layer maintained homeostatic patterns.

