Figure 3.
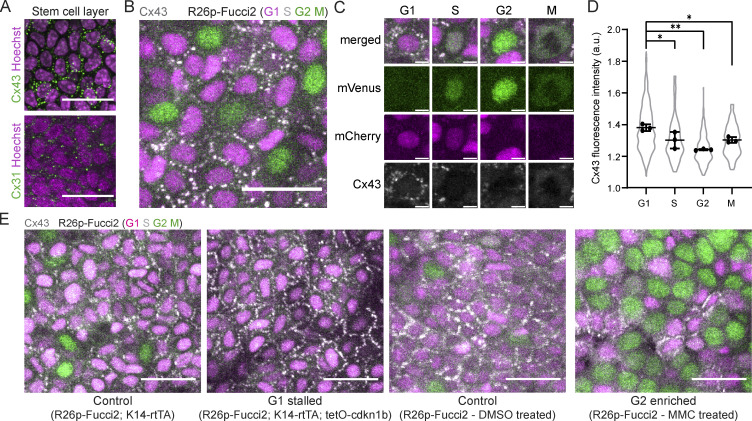
Cx43 distribution at junctions is enriched in G1 basal stem cells. (A) Maximum intensity projection of whole-mount immunofluorescence staining for Cx43 (top in green) and Cx31 (bottom in green) in the basal stem cell layer (Hoechst marking nuclei in magenta). Scale bar: 25 µm. (B) Maximum intensity projection of whole-mount immunofluorescence staining for Cx43, shown in white, in R26p-Fucci2 mice, where G1 and S cells are mCherry+ (magenta) and S, G2, and M cells are mVenus+ (green). Scale bar: 25 µm. (C) Insets of G1, S, G2, and M cells in Rosa26p-Fucci2 mice with Cx43 immunofluorescence staining shown in white. Scale bar: 5 µm. (D) Quantification of Cx43 mean fluorescence intensity at the borders of G1, S, G2, and M cells in Rosa26p-Fucci2 mice. *P < 0.05, **P < 0.01, one-way ANOVA, n = 3 control and 3 Cx43 cKO mice. (E) Cx43 whole-mount immunofluorescence staining (white) in G1- and G2-enriched Rosa26p-Fucci2 mice, where G1 and S cells are mCherry+ (magenta) and S, G2, and M cells are mVenus+ (green). G2 depleted and control (K14-rtTA; tetO-cdkn1b; R26p-Fucci2 and K14-rtTA; R26p-Fucci2) tissue was collected 3 d after induction. G2-enriched MMC-treated and DMSO-treated control R26p-Fucci2 tissue was collected 2 d after treatment. Scale bar: 25 µm.

