Figure 4.
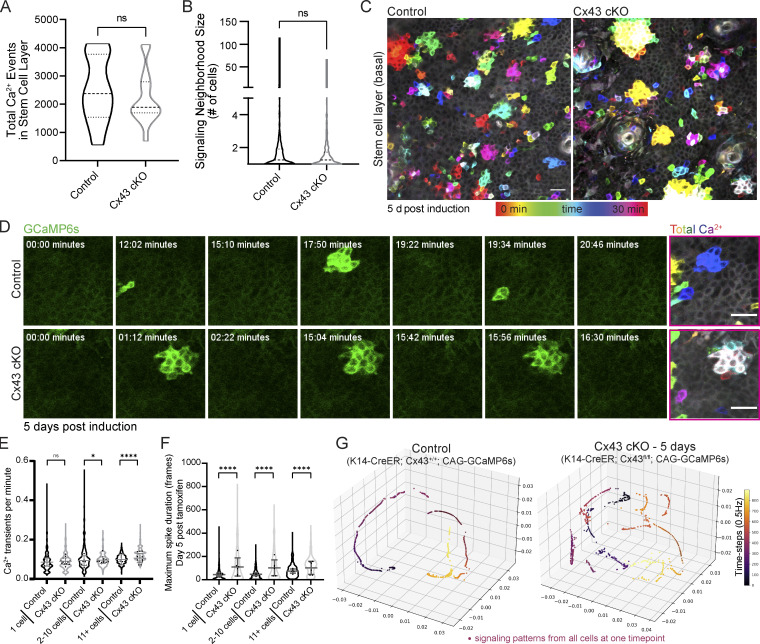
Cx43 is necessary for long-range Ca2+ signaling coordination but not local signaling activity. (A) Total number of Ca2+ signaling events in control versus Cx43 cKO mice. ns = P > 0.05, unpaired two-tailed Student’s t test, n = 11 (control) and 14 (Cx43 cKO) recordings from at least three mice per condition. (B) Average neighborhood size of signaling in control versus Cx43 cKO mice. ns = P > 0.05, unpaired two-tailed Student’s t test, n = 11 (control) and 14 (Cx43 cKO) recordings from at least three mice per condition. (C) Max intensity projection of 30-min recordings of the stem cell pool of control and Cx43 cKO Ca2+-sensor mice 5 d after induction (Rosa26-CAG-GCaMP6s; K14-CreER; Cx43+/+ and Rosa26-CAG-GCaMP6s; K14-CreER; Cx43fl/fl). Color scale represents time. Repeated signaling manifests as a white signal (the sum of colors). Scale bar: 25 µm. (D) Time-course of clustered signaling from 30-min movies of the stem cell pool of control and Cx43 cKO Ca2+-sensor mice 5 d after induction. Last image on right is max intensity projection with time represented by a color scale. Scale bar: 25 µm. (E) Ca2+ transients per minute per cell for three patterns of Ca2+ signaling (1 cell, 2–10 cells, or 11+ cells) in control versus Cx43 cKO Ca2+-sensor mice. ns = P > 0.05, *P = 0.0139, ****P < 0.0001, Mann–Whitney test. (F) Maximal spike duration of Ca2+ transients per cell for three patterns of Ca2+ signaling (1 cell, 2–10 cells, or 11+ cells) in control versus Cx43 cKO mice 5 d after tamoxifen induction. ****P < 0.0001, Mann–Whitney test. (G) Representative PHATE visualization of Ca2+ signaling in the Cx43 cKO versus control stem cell pool shows disruption of smooth, directed, and coordinated patterns of signaling in mice 5 d after loss of Cx43.

