Figure 5.
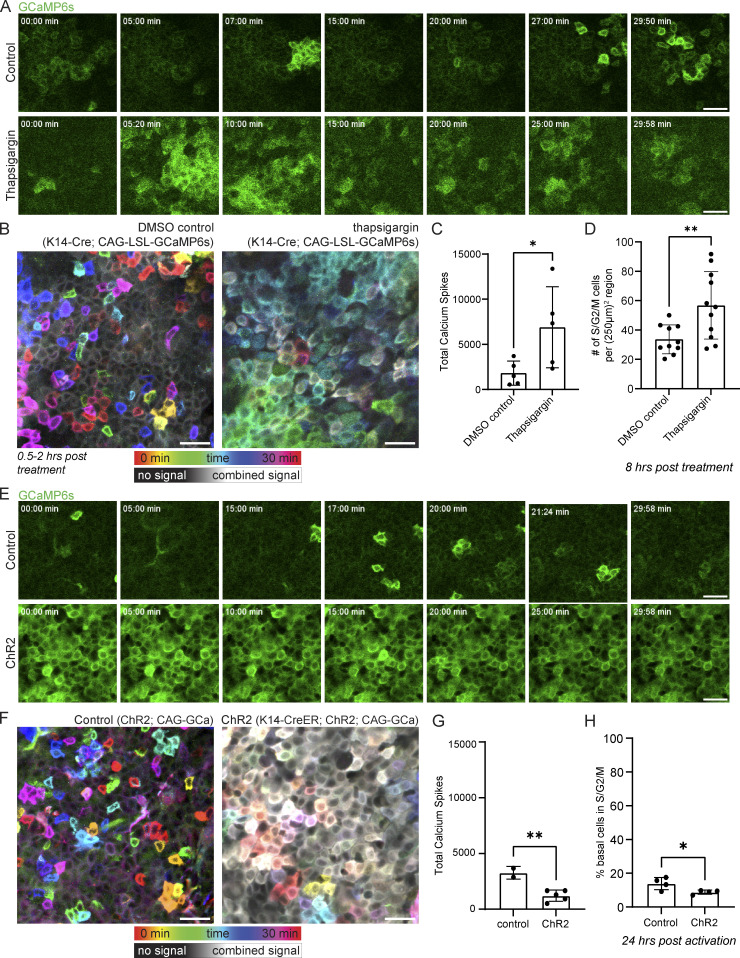
Coordinated Ca2+ signaling regulates entrance into the cell cycle. (A) Time-course of signaling from 30-min movies of the stem cell pool of DMSO control- and thapsigargin-treated Ca2+-sensor mice 0.5–2 h after treatment. Scale bar: 25 µm. (B) Representative max intensity projection of 30-min recordings of the basal layer of DMSO control and thapsigargin treated Ca2+-sensor mice, showing increased Ca2+ dynamics in the hours after thapsigargin treatment. Color scale indicates GCaMP6s signal across time. Scale bar: 25 µm. (C) Total Ca2+ events identified in thapsigargin-treated mice versus DMSO treated controls. *P = 0.0417, unpaired two-tailed Student’s t test, n = 5 control movies and 5 thapsigargin movies. (D) Number of cycling S, G2, and M cells in the basal stem cell layer of R26p-Fucci2 mice 8 h after treatment with thapsigargin or DMSO vehicle control. **P = 0.0083, unpaired two-tailed Student’s t test, n = 6 250 × 250 µm regions from each of the 11 thapsigargin-treated and 10 DMSO vehicle-treated mice. (E) Time-course of signaling from 30-min movies of the stem cell pool of control and ChR2 optogenetic Ca2+-sensor mice during blue light activation. Scale bar: 25 µm. (F) Representative max intensity projection of 30-min recordings of the basal layer of control and ChR2 optogenetic Ca2+-sensor mice during light activation, showing increased resting Ca2+ levels. Color scale indicates GCaMP6s signal across time. Scale bar: 25 µm. (G) Total Ca2+ events identified in light-activated ChR2 mice versus genetic controls. **P = 0.0049, unpaired two-tailed Student’s t test, n = 2 control and 5 ChR2 mice. (H) Quantification of epidermal single cell suspensions processed from ears of either K14CreER; CAG-LSL-ChR2 or control (CAG-LSL-ChR2) mice 10 d after induction with 2 mg of tamoxifen and 24 h after exposure to 1 h of constant blue LED light. Cells were gated using a basal marker (anti-CD49f) and stained with Vybrant DyeCycle Violet Stain to determine the cell cycle stage (G1 or S/G2/M). The results show a decrease in basal cells entering S/G2/M in K14-CreER; CAG-LSL-ChR2 mice compared to controls. *P = 0.0356, unpaired two-tailed Student’s t test, n = 4 mice per experimental and control groups.

