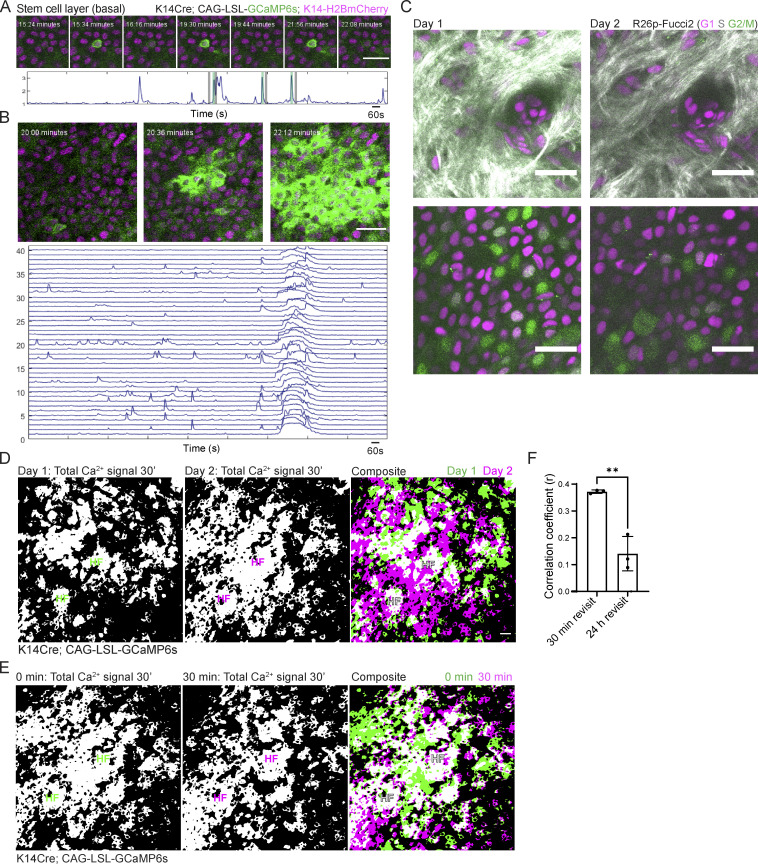
Figure S1.
Pervasive, fast Ca2+ dynamics are specific to the regenerative basal layer of the epidermis. (A) Region of the basal stem cell layer where a single cell spikes repeatedly over 30 min of imaging (K14-Cre; Rosa26-CAG-LSL-GCaMP6s; K14-H2B-mCherry). Normalized fluorescence intensity plotted over the duration of 30-min timelapse is below. Black and green bars indicate timepoints corresponding to the snapshots above. Scale bars: 25 µm. (B) Different regions of the stem cell layer, where a large group of cells exhibit an ICW. Normalized fluorescence intensity plotted over the 30-min timelapse for 40 of the cells involved in the ICW is below. Scale bars: 25 µm. (C) Revisit of the same region of a Rosa26p-Fucci2 mouse at 0 and 24 h. Top panel shows dermis and bottom panel shows the epidermal basal layer. Collagen is in white, G1 cells are in magenta, S cells are double positive for magenta and green and shown in gray, and G2 and M cells are in green. Scale bars: 25 µm. (D) Maximum intensity projection of all optical sections of 30-min timelapses from the same region of the epidermis at 0 min and 24 h. To the right, a composite image of the max intensity projections at 0 (green) and 24 h (magenta). White indicates overlapping regions of Ca2+ signaling. Scale bars: 25 µm. Transverse views of the top of the infundibulum region of hair follicles marked with HF to orient us in revisiting the region. (E) Maximum intensity projection of all optical sections of a 30-min timelapse at 0 and 30 min of the same region of the epidermis. To the right, composite image of the same region at 0 (green) and 30 min (magenta), where white indicates overlapping regions of Ca2+ activity. Transverse views of the top of the infundibulum region of hair follicles marked with HF to orient us in revisiting the region. (F) Correlation coefficient quantification of pixel overlap of Ca2+ signaling during 30-min timelapses from revisits of the basal layer taken at 30 min and 24 h timepoints. **P < 0.01, unpaired two-tailed Student’s t test. n = 3 mice.

