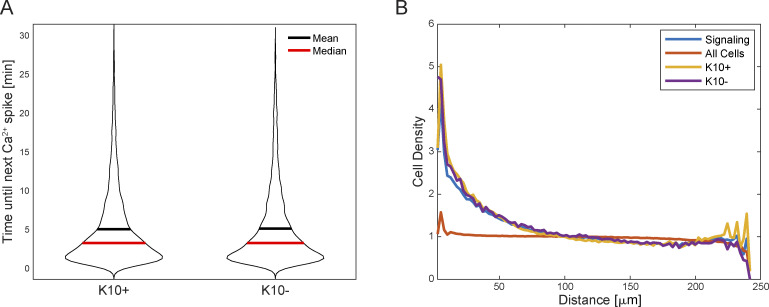
Figure S2.
K10+ and K10− populations do not show differences in some spatiotemporal signaling characteristics. (A) Time interval between Ca2+ signal peaks for each cell (cells with one peak or less are ignored). ns = P = 0.9234, non-parametric Kruskal–Wallis test. (B) Average density of signaling cells around all cells (orange), signaling cells (blue), K10+ cells (yellow), or K10− cells (purple). The spatial distribution of all cells (signaling or not) is uniform. Signaling cells are clustered, but there is no significant difference between K10+ and K10− signaling cells. ns = P = 0.148, non-parametric Kruskal–Wallis test.

