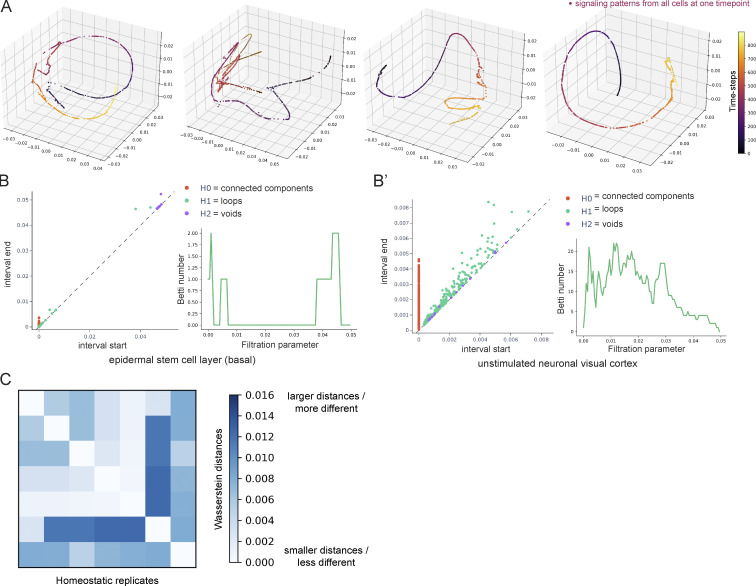
Figure S3.
Unsupervised modeling of Ca2+ signaling patterns reveals smooth, directed signaling in the homeostatic basal epidermis. (A) PHATE visualizations of Ca2+ signaling time trajectories in the homeostatic basal epithelial layer from four 30-min timelapse movie replicates show smooth trajectories. (B) Persistence diagrams of Ca2+ signaling time trajectories in the quiescent neuronal visual cortex (right) versus the homeostatic epithelial stem cell layer (left). Each point corresponds to a topological feature in the trajectory, which appears at a certain interval start time and disappears at an interval end time, as data is gradually coarse-grained by merging nearby points across increasing levels of granularity. As an example, green points represent H1 features that correspond to the formation of loops in the trajectory while purple dots represent H2 features that correspond to the formation of voids. The further they are from the diagonals, the longer they exist, i.e., the larger their persistence. To the right, examples of corresponding Betti curves of H1 loop features. The Betti numbers represent the number of loops found at increasing levels of granularity (as the filtration parameter increases). The epidermal stem cell layer shows loop features at large filtration values, whereas the dataset from the neuronal visual cortex shows more complexity and loops across all filtration parameters. (C) Heatmap of Wasserstein distances of H0 features from seven timelapse movies (from at least three different mice) of the homeostatic epidermal stem cell layer, showing small differences in the signaling patterns across replicates.

