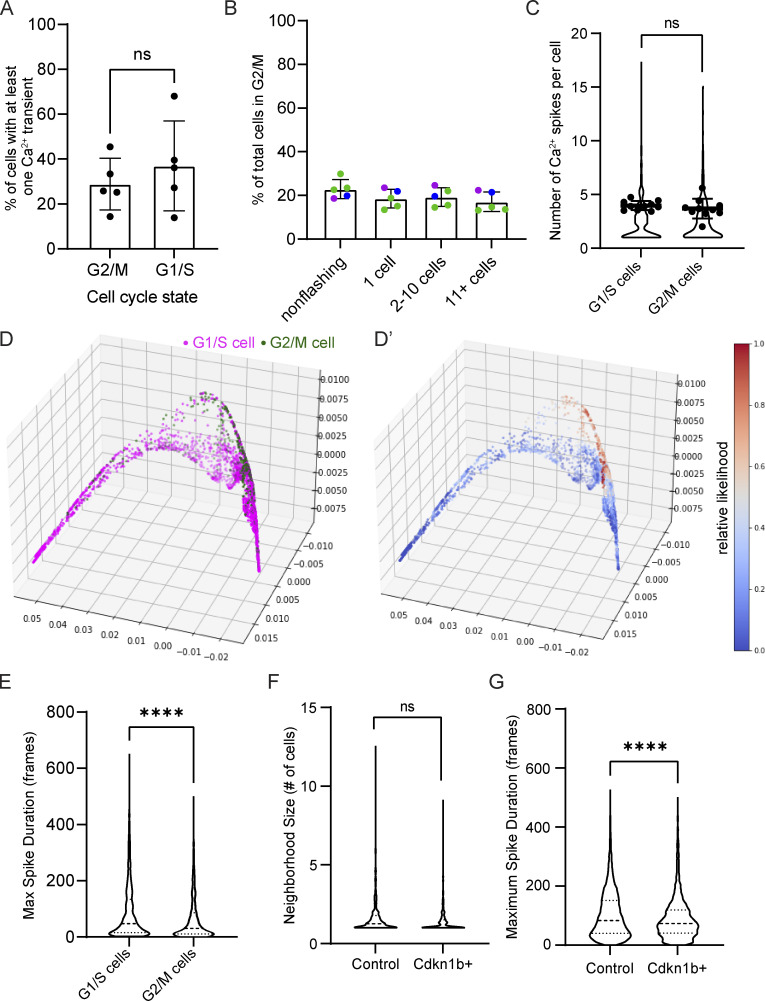
Figure S4.
Cell cycle–specific Ca2+ signaling. (A) Percent of G1/S versus G2/M cells flashing over the course of 30 min. ns = P > 0.05, unpaired two-tailed Student’s t test, n = 5 30-min timelapse movies from three mice. (B) Percent of G2/M cells in groups of non-flashing, single flashing, small clusters, and large clusters of flashing cells based on mCherry-hCdt1 expression. ns = P > 0.05, one-way ANOVA with multiple comparisons, n = 5 30-min timelapse movies from three mice. (C) Number of Ca2+ spikes quantified per cell in G1/S cells versus G2/M cells. ns = P > 0.05, unpaired two-tailed Student’s t test, n = 10 timelapse movies from four individual mice. (D) PHATE visualization of cell embeddings of Ca2+ signaling patterns, where each dot represents a single cell; its position in space represents how similar its Ca2+ signaling is to other cells in space; each cell or node is colored by its cell cycle state based on nuclear Fucci2 signal. (D’) MELD comparison of G1/S versus G2/M signaling patterns. Values close to 0.5 represent the most overlap between the two populations. (E) Maximal spike duration (maximum number of frames between the start and end of individual Ca2+ events) in G1/S versus G2/M cells. P < 0.0001, Mann–Whitney test, n = 5,218 G1/S cells and 1,040 G2/M cells from 10 timelapse movies. (F) Frequency of different neighborhood sizes of spatiotemporally connected Ca2+ signaling from 30-min timelapses of cdkn1b+ G1-stalled basal layers versus control in Ca2+ sensor mice. ns = P > 0.05, unpaired two-tailed Student’s t test, n = 9 control and 8 Cdkn1b+ timelapse recordings. (G) Maximal spike duration in control versus G1-stalled cdkn1b+ mice. P < 0.0001, Mann–Whitney test, n = 7,184 cells from 9 control timelapse recordings and 2,470 cells from 8 cdkn1b+ timelapse recordings.

