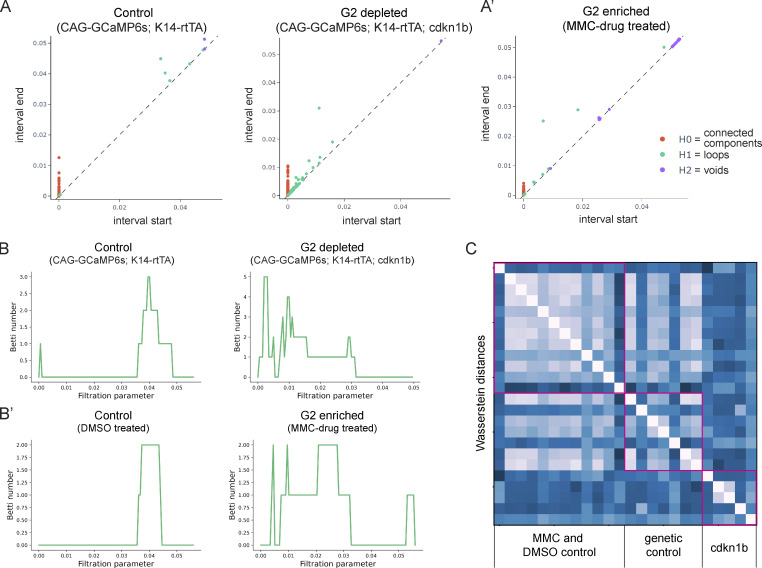
Figure S5.
Enrichment of G2 cells uniquely does not disrupt coordinated Ca2+ signaling. (A and A’) Representative persistence diagrams (H0: connected components, H1: loops, H2: voids) for G2-depleted (A) and G2-enriched (A’) conditions (CAG-GCaMP6s; K14-rtTA; cdkn1b 3 d after induction and K14-Cre; CAG-LSL-GCaMP6s 2 d after MMC drug treatment, respectively). The persistence diagram from the G1-stalled group has earlier H1 (loop) features, indicating scattered trajectories and less coordinated signaling. (B) Representative Betti curves of H1 features (loops) for G1 and G2 enriched conditions (CAG-GCaMP6s; K14-rtTA; cdkn1b 3 d after doxycycline treatment and K14-Cre; CAG-LSL-GCaMP6s 2 d after MMC drug treatment, respectively). (C) Heatmap of the Wasserstein distances from the persistence diagrams of G2-enriched MMC, DMSO control, G1-stalled Cdkn1b, and genetic control mice. Distances are small and similar across G2-enriched and all control mice and larger and different when compared to G1-stalled mice.

