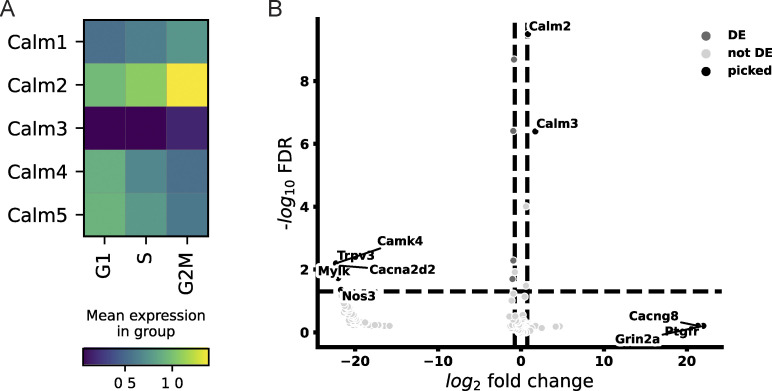
Figure S6.
G2 cells show differential transcription of key Ca2+ signaling genes. (A) Heatmap of gene expression patterns of Calmodulin genes showing changes of epidermal basal cells during cell cycle progression. Expression levels are shown as average of log-normalized expression. (B) Volcano plot showing differentially expressed Ca2+ signaling genes in G1/S versus G2/M cells. DE, differentially expressed; picked, top 10 genes.

