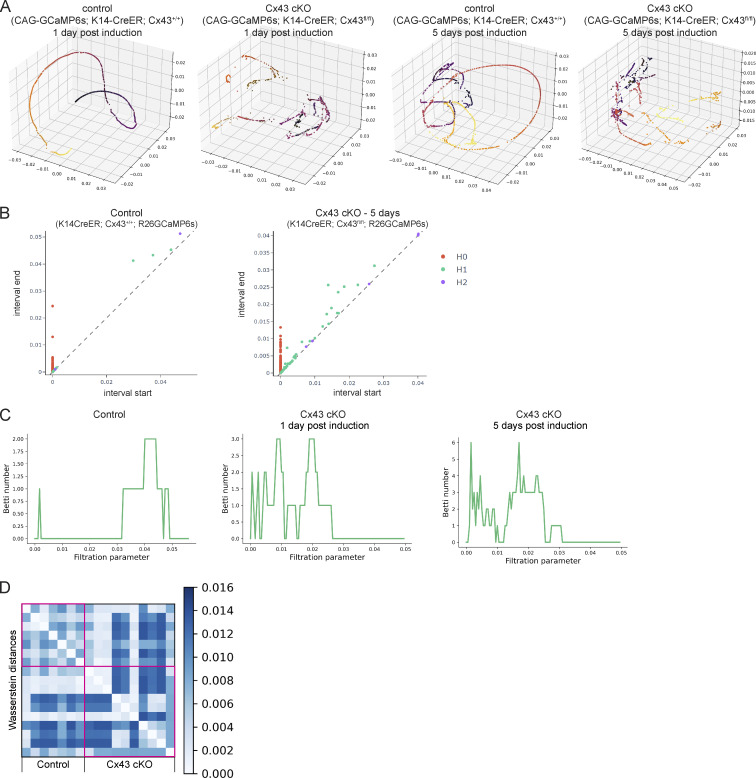
Figure S8.
Loss of Cx43 disrupts coordinated Ca2+ signaling patterns. (A) Further PHATE visualizations of Ca2+ signaling time trajectories in the Cx43 conditional knockout versus control basal layer show disruption of smooth, directed, and coordinated patterns of signaling in mice 1 and 5 d after loss of Cx43. (B) Representative persistence diagrams (H0: connected components, H1: loops, H2: voids) for control and Cx43 cKO mice (Rosa26-CAG-GCaMP6s; K14-CreER; Cx43+/+ and Rosa26-CAG-GCaMP6s; K14-CreER; Cx43fl/fl) 5 d after induction. H1 features from Cx43 cKO mice appear later in time and have a longer persistence. (C) Representative Betti curves of H1 features (loops) for control and Cx43 cKO mice (Rosa26-CAG-GCaMP6s; K14-CreER; Cx43+/+ and Rosa26-CAG-GCaMP6s; K14-CreER; Cx43fl/fl) 1 and 5 d after tamoxifen induction. (D) Heatmap of Wasserstein distances of H0 features from timelapse movies of the epidermal stem cell layer in Cx43 cKO versus control mice, showing larger distances when comparing cKO with wildtype controls.

