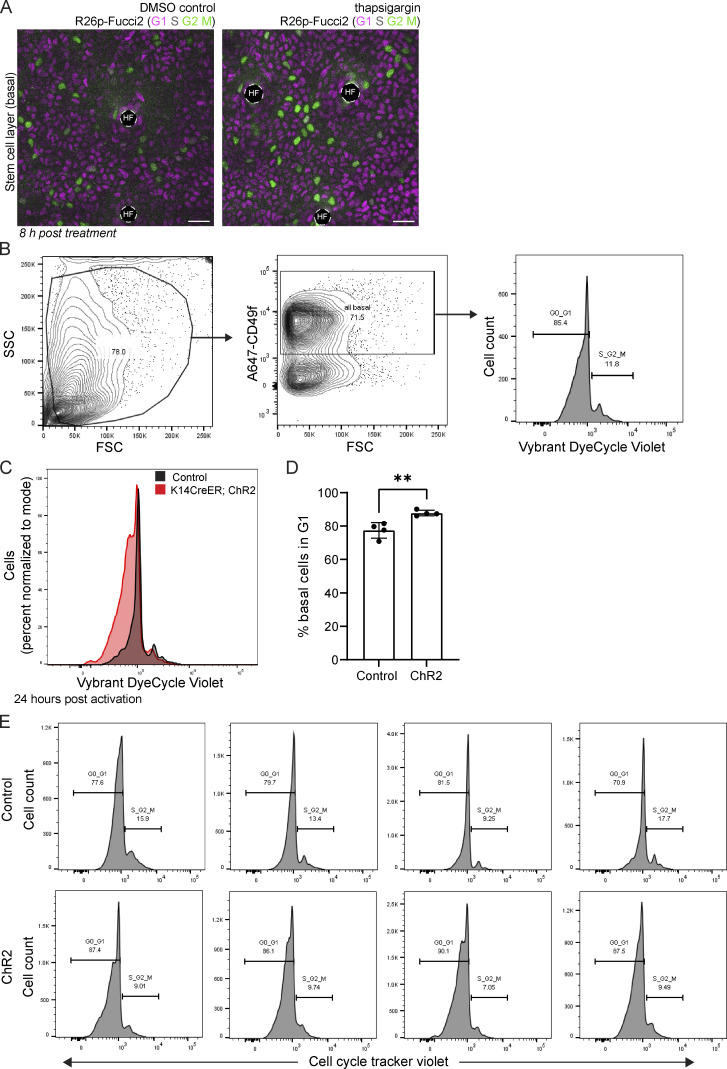
Figure S9.
Changing tissue-wide Ca2+ dynamics affects the cell cycle distribution within the epidermal stem cell layer. (A) R26p-Fucci2 mice 8 h post-thapsigargin treatment versus DMSO control. G1 cells are in magenta, S cells are double positive for magenta and green and shown in gray, and G2 and M cells are in green. Scale bar: 25 µm. (B) Epidermal single cell suspensions were processed from ears of either K14-CreER; ChR2 or control (ChR2) mice 10 d after induction with 2 mg tamoxifen and 24 h after exposure to 1 h of constant blue LED light for flow cytometry and gated for basal cells using anti-CD49f. Cell cycle stage (G1 or S/G2/M) was determined using the gating strategy outlined in the Vybrant DyeCycle Violet Stain product protocol. (C) Representative flow cytometry histogram plots of ear basal cells stained with Vybrant DyeCycle Violet comparing K14-CreER; ChR2 (red) and control mice (black) showing a decrease in cells entering S/G2/M in the light-activated K14-CreER;ChR2 mice. (D) Quantification of epidermal single cell suspensions processed from ears of either K14-CreER; ChR2 or control (ChR2) mice 10 d after induction with 2 mg of tamoxifen and 24 h after exposure to 1 h of constant blue LED light. Cells were gated using a basal marker (anti-CD49f) and stained with Vybrant DyeCycle Violet Stain to determine cell cycle stage (G1 or S/G2/M). The results show an increase in G1 basal cells in K14-CreER;ChR2 mice compared with controls. **P = 0.0057, unpaired two-tailed Student’s t test, n = 4 mice per experimental and control groups. (E) Replicate flow cytometry histogram plots of ear basal cells stained with Vybrant DyeCycle Violet comparing K14-CreER; ChR2 and control mice showing a decrease in cells entering S/G2/M in the light-activated K14-CreER; ChR2 mice.

