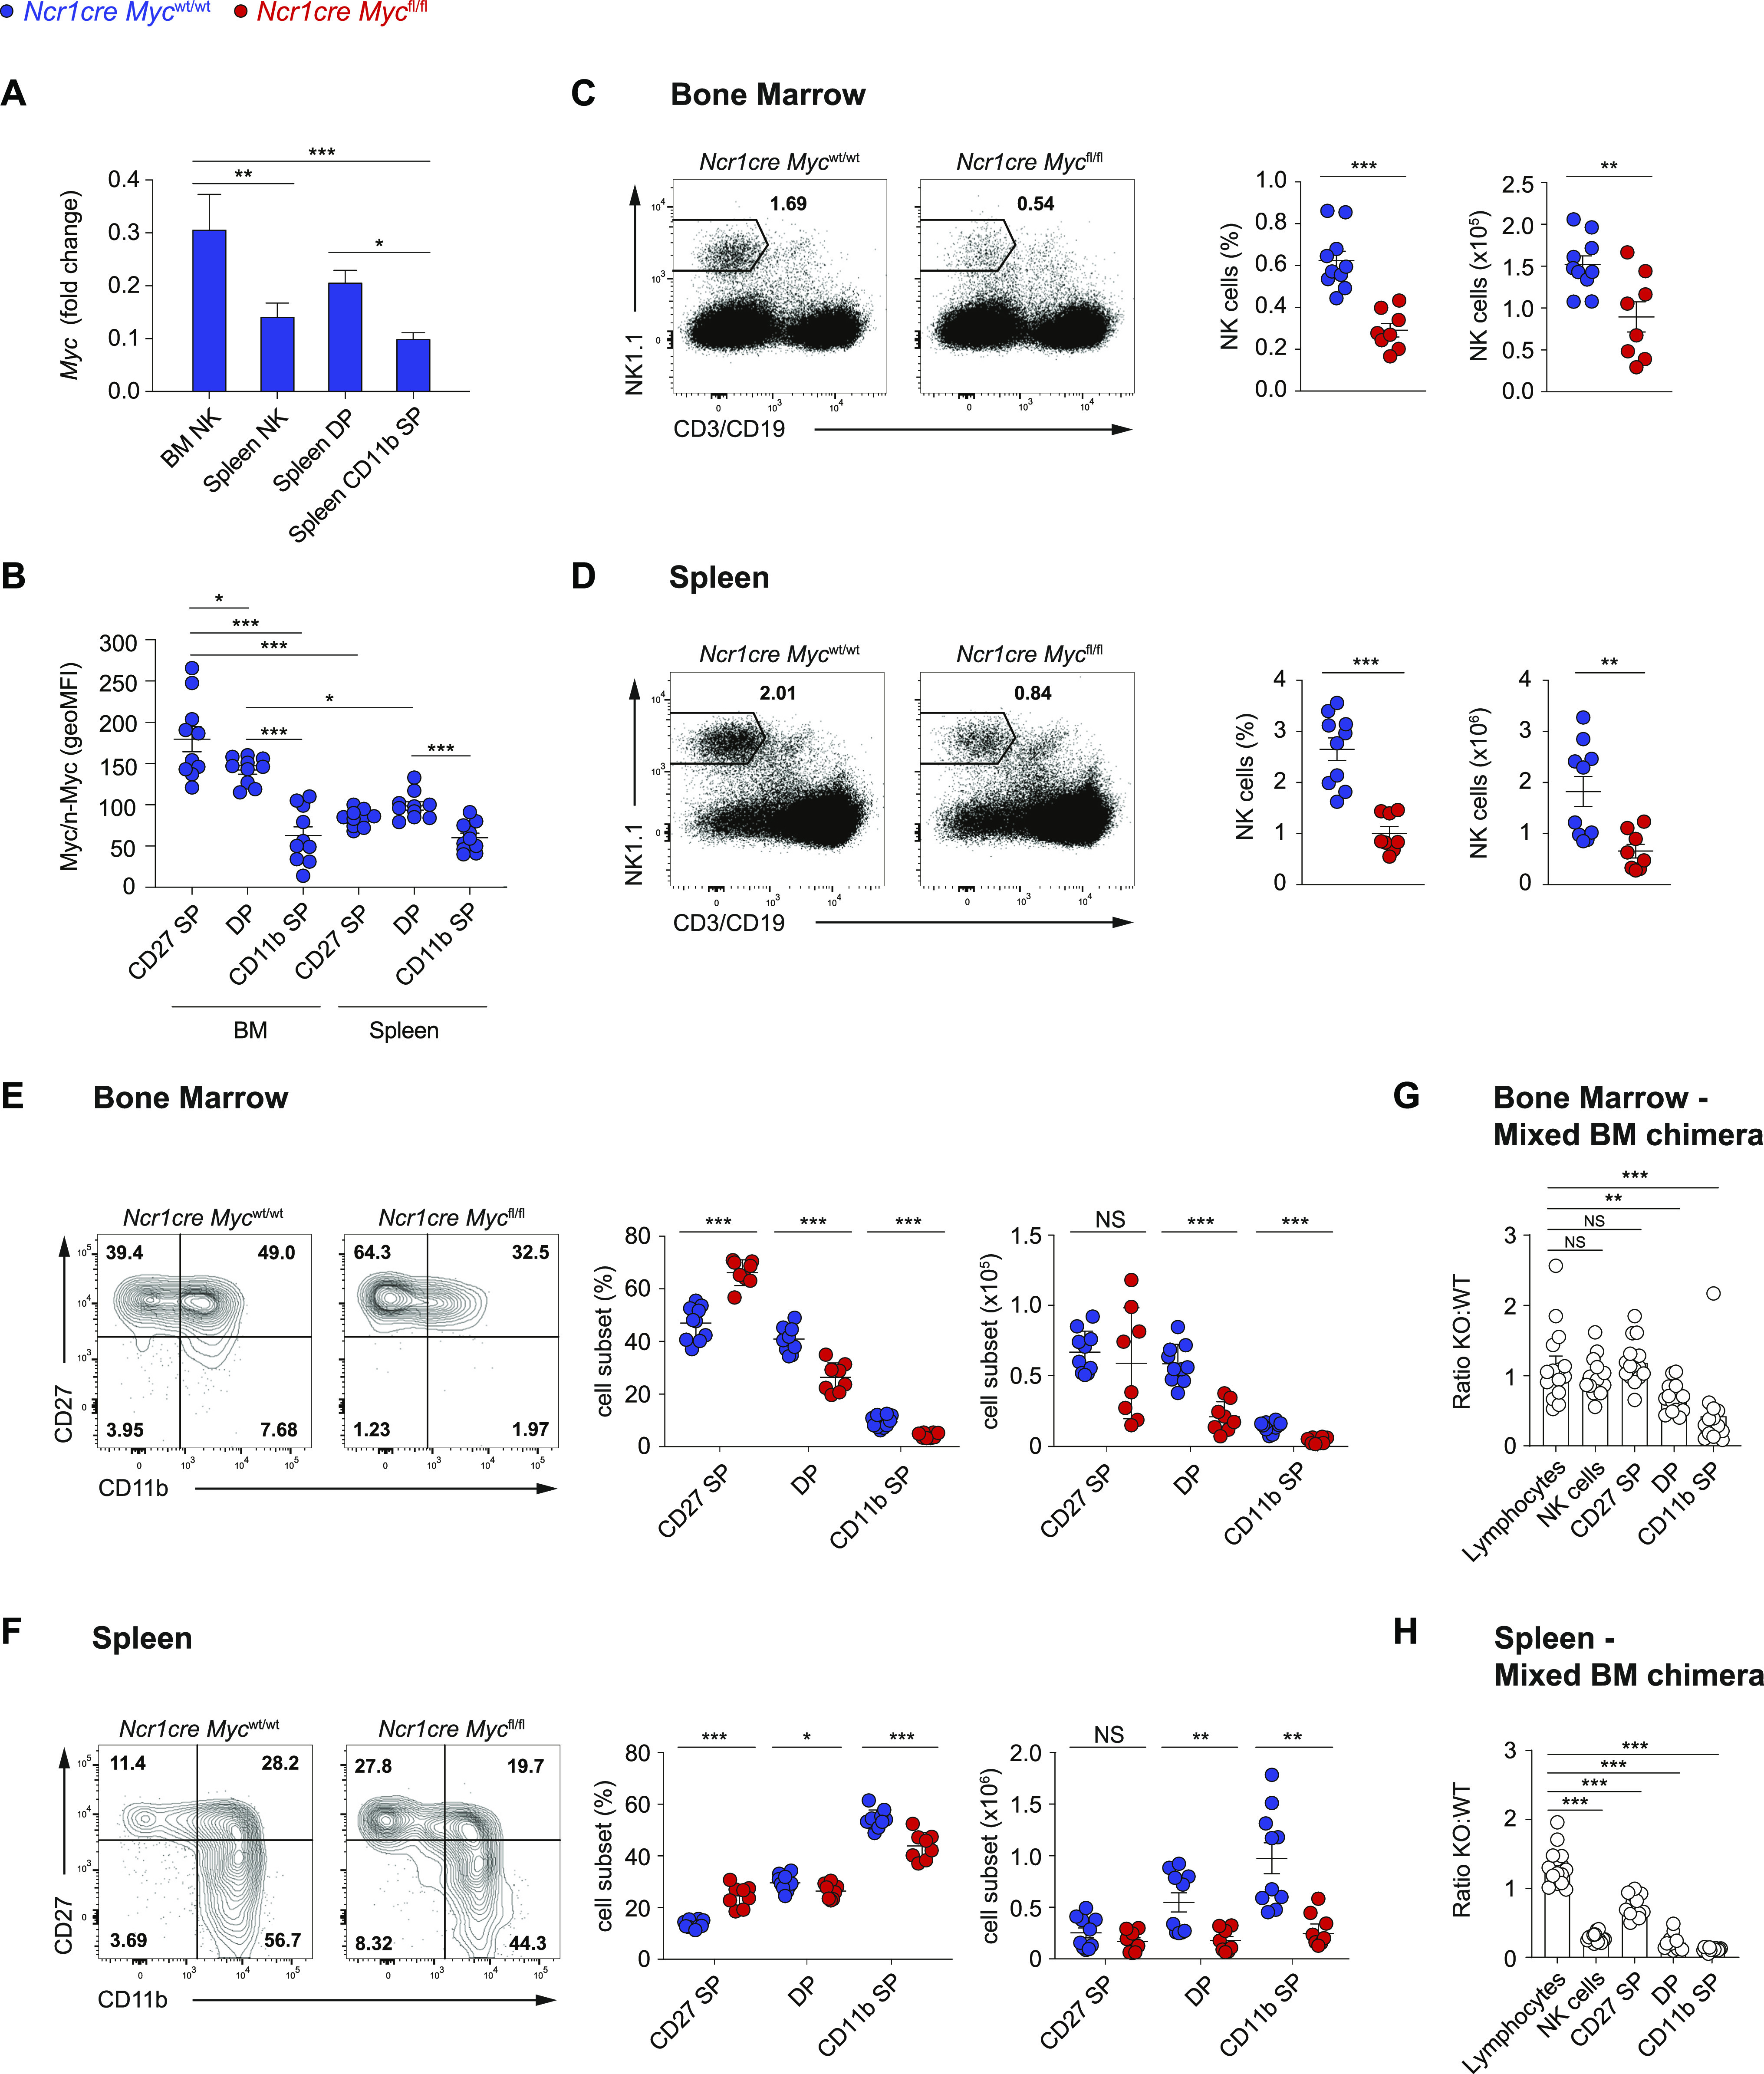
Figure 1. Ncr1cre Mycfl/fl mice present severely decreased NK cell numbers.

(A) qRT–PCR analysis (normalized to Polr2a and 18s) is shown for Myc mRNA in sorted BM NK cells (NK1.1+Ncr1+CD3/19−), and splenic total (NK1.1+Ncr1+CD3/19-), double-positive (DP; CD27+CD11b+), and CD11b single-positive (CD11b SP; CD27−CD11b+) NK cells from C57BL/6 mice. (B) Myc expression levels in the CD27 single-positive (CD27 SP; CD27+CD11b−), DP, and CD11b SP NK cell subsets (NK1.1+CD3−) from the BM and spleen are expressed as geometric MFI. (C, D) A representative flow cytometry plot and a quantification of percentages and numbers of NK cells in the BM ((C), CD122+NK1.1+Ncr1+CD3/19−) and spleen ((D), NK1.1+Ncr1+CD3/19−) of the indicated mice are shown. (E, F) A representative flow cytometry plot and a quantification of percentages and numbers of BM (E) and splenic (F) CD27 SP, DP, and CD11b SP NK cell populations. (G, H) Graphs depict the ratio of Ncr1cre Mycfl/fl over Ncr1cre Mycwt/wt for lymphocytes, total, CD27 SP, DP, and CD11b SP NK cells (CD122+NK1.1+CD3/19−) in the BM (G) and spleen (H) of mixed BM chimeras. (A, B, C, D, E, F, G, H) Results depict mean ± SD (n = 3 technical replicates) and are representative of at least two experiments (A), mean ± SEM of n = 10 (B), n = 8−10 (C, D, E, F), and n = 15 (G, H) mice per condition and are a pool of two experiments (B, C, D, E, F, G, H). (B, C, D, E, F, G, H) Each symbol represents an individual mouse. (A, B, C, D, E, F, G, H) Statistical comparisons are shown; *P ≤ 0.05, **P ≤ 0.01, ***P ≤ 0.001, and NS, non-significant; one-way ANOVA test (A, B), t test, unpaired (C, D, E, F, G, H). (A, B) Only statistically significant differences are shown in (A) and only statistically significant differences comparing NK cell subsets in the same organ and the same subsets across the two organs are shown (B).
