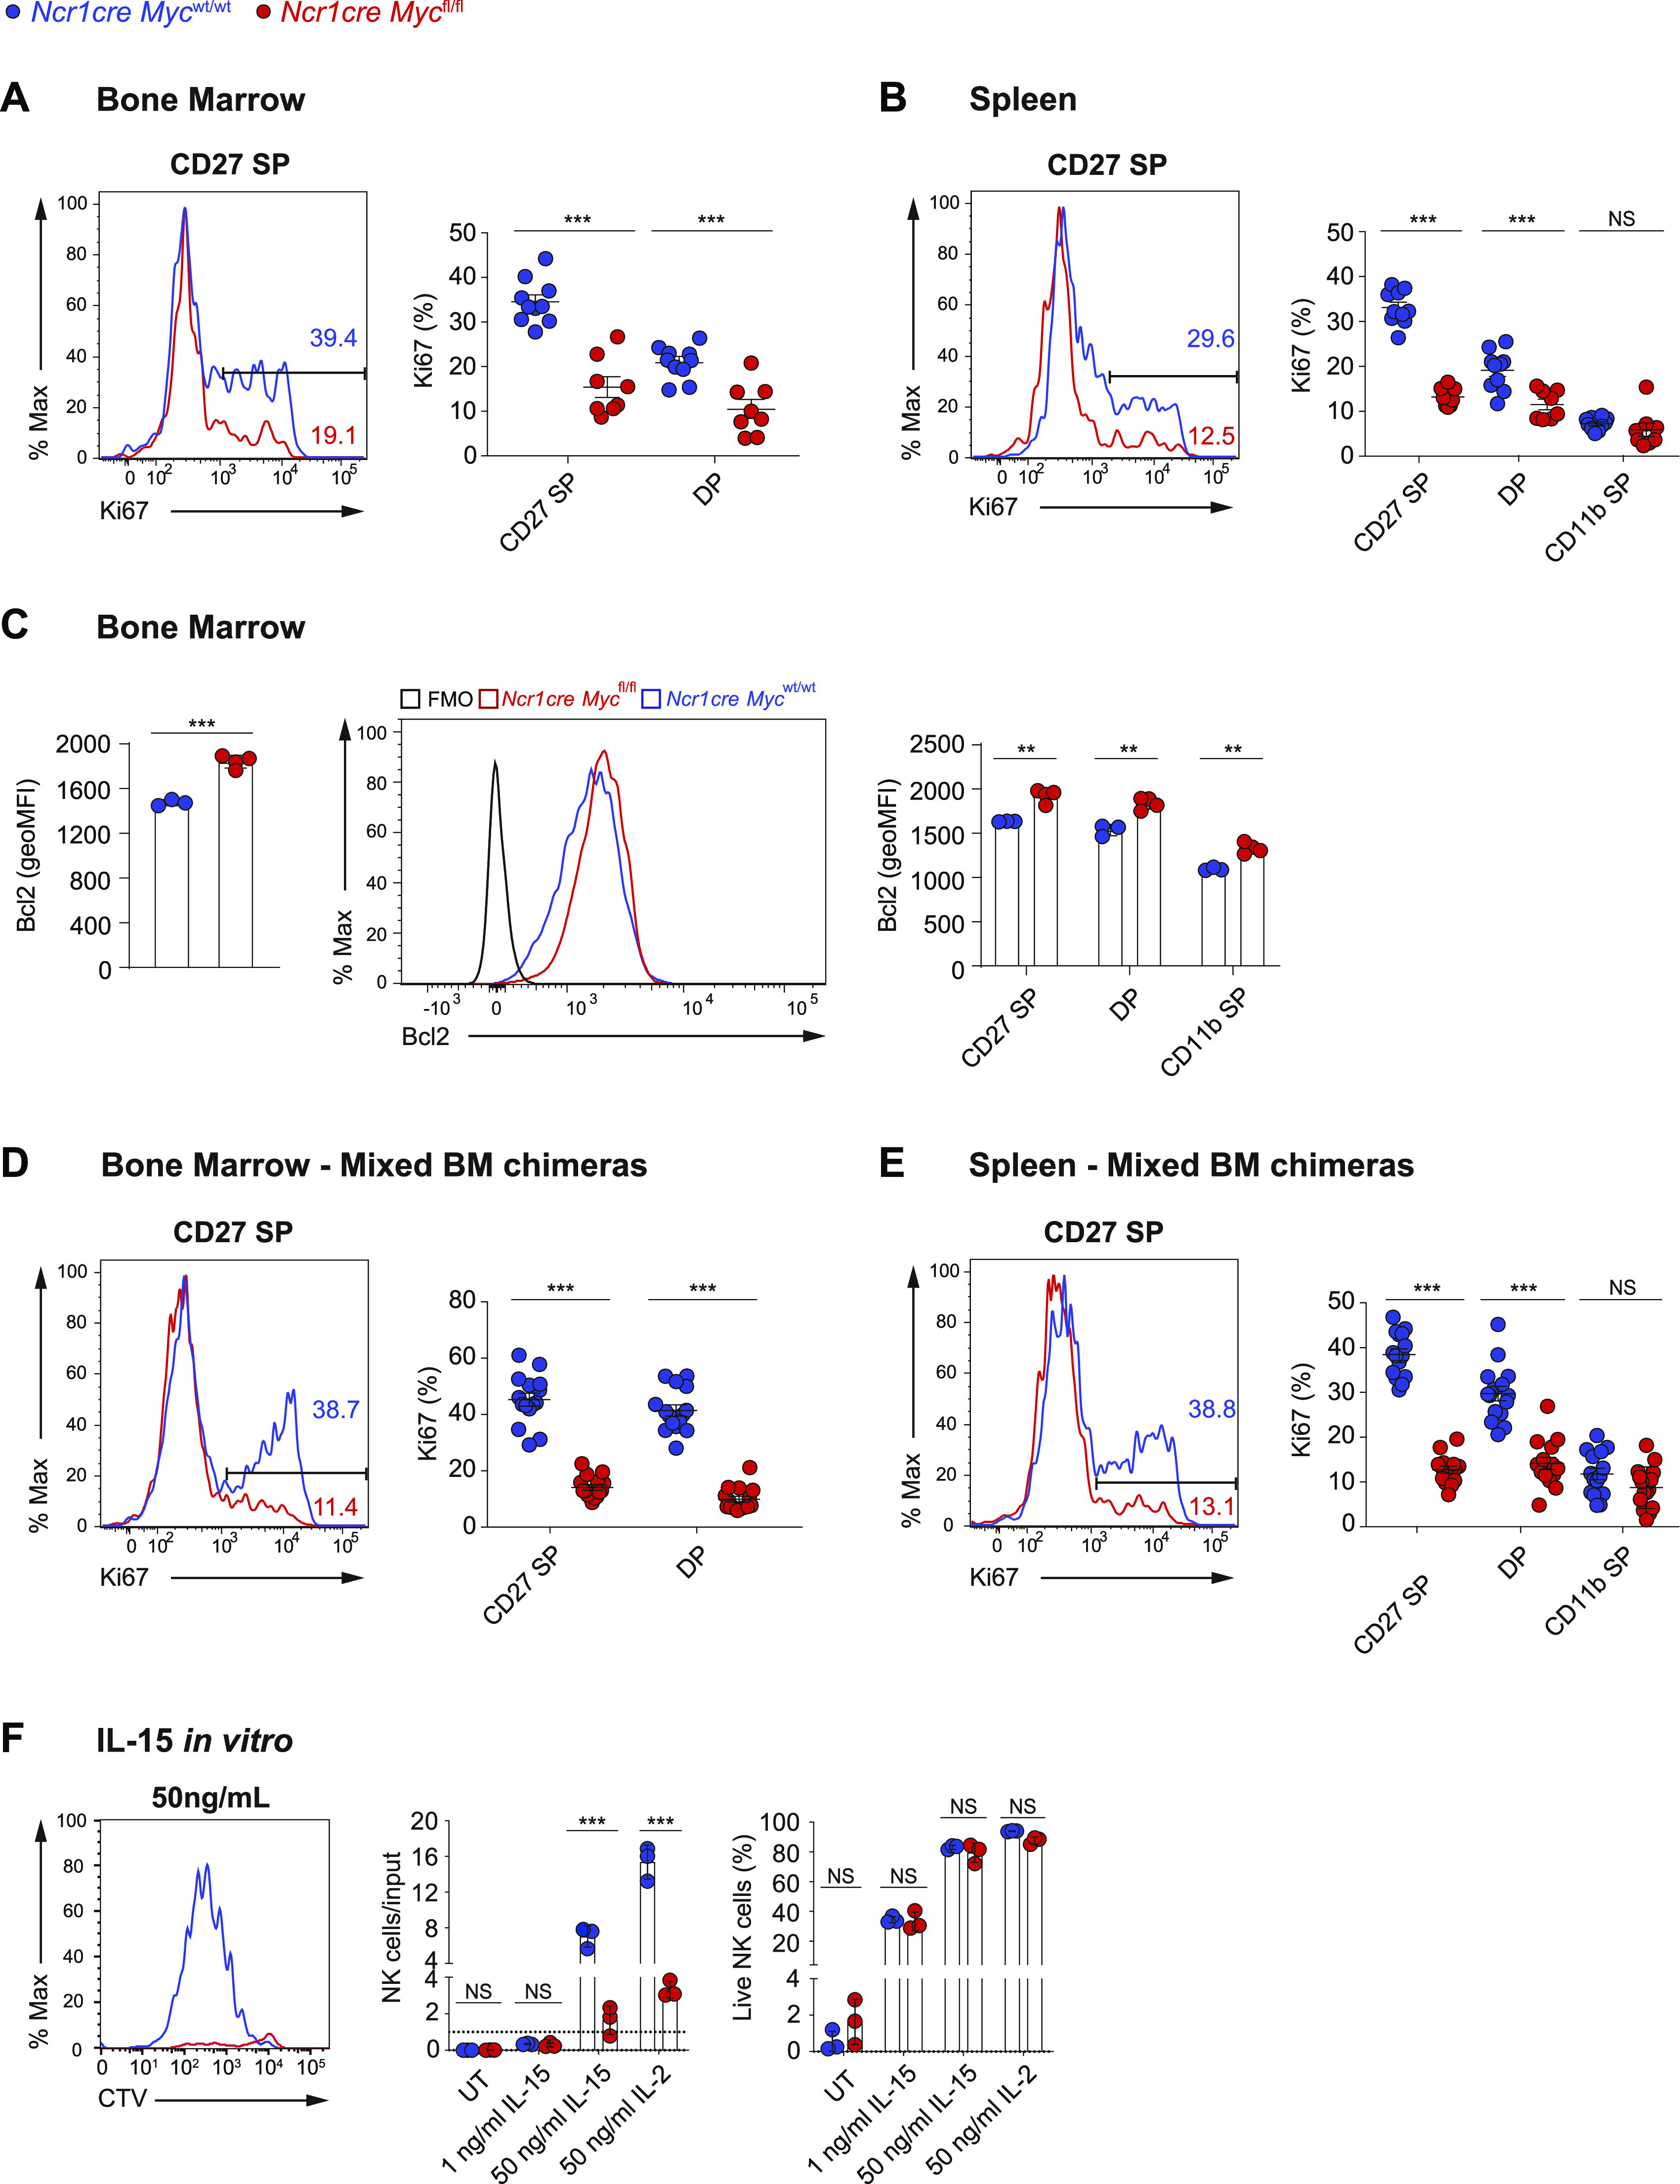
Figure 2. Myc-deficient NK cells exhibit a defective response to IL-15.

(A, B) Percentages of Ki67+ cells among the indicated subsets are shown in the BM (A) and spleen (B) of Ncr1cre Mycfl/fl and Ncr1cre Mycwt/wt mice. (C) Graphs show geometric mean and a representative flow cytometry plot of Bcl2 expression in BM NK cells (NK1.1+Ncr1+CD3−) and in CD27 SP, DP, and CD11b SP NK cells of indicated genotypes. (D, E) Percentages of Ki67+ cells among the indicated subsets in the BM (D) and spleen (E) of Ncr1cre Mycfl/fl and Ncr1cre Mycwt/wt mixed BM chimeras. (F) Splenocytes from Ncr1cre Mycfl/fl and control mice were cultured in vitro in the presence of the indicated doses of IL-15 or IL-2. Graphs show a representative cytometric profile of cell trace violet dilution by NK cells (gated as NK1.1+ CD3/19−), the ratio of live NK cell numbers (PI negative) normalized to the numbers of seeded NK cells of the same genotype, and the percentage of live cells among the NK population of the indicated genotypes after 4 d of culture. (A, B, C, D, E, F) Results represent mean ± SEM of n = 8–10 mice per genotype (A, B), ± SEM of n = 3–4 mice per genotype (C), n = 15 chimeric mice (D, E), mean ± SD of n = 3 technical replicates and are a pool of two independent experiments (A, B, D, E) or representative of at least two independent experiments (C, F) and each symbol represents an individual mouse (A, B, C, D, E). (A, B, C, D, E, F) Statistical comparisons are shown; **P ≤ 0.01, ***P ≤ 0.001, and NS, non-significant; t test, unpaired.
