
Figure 3. Myc protein levels are induced by IL-15 through mTOR and ERK.
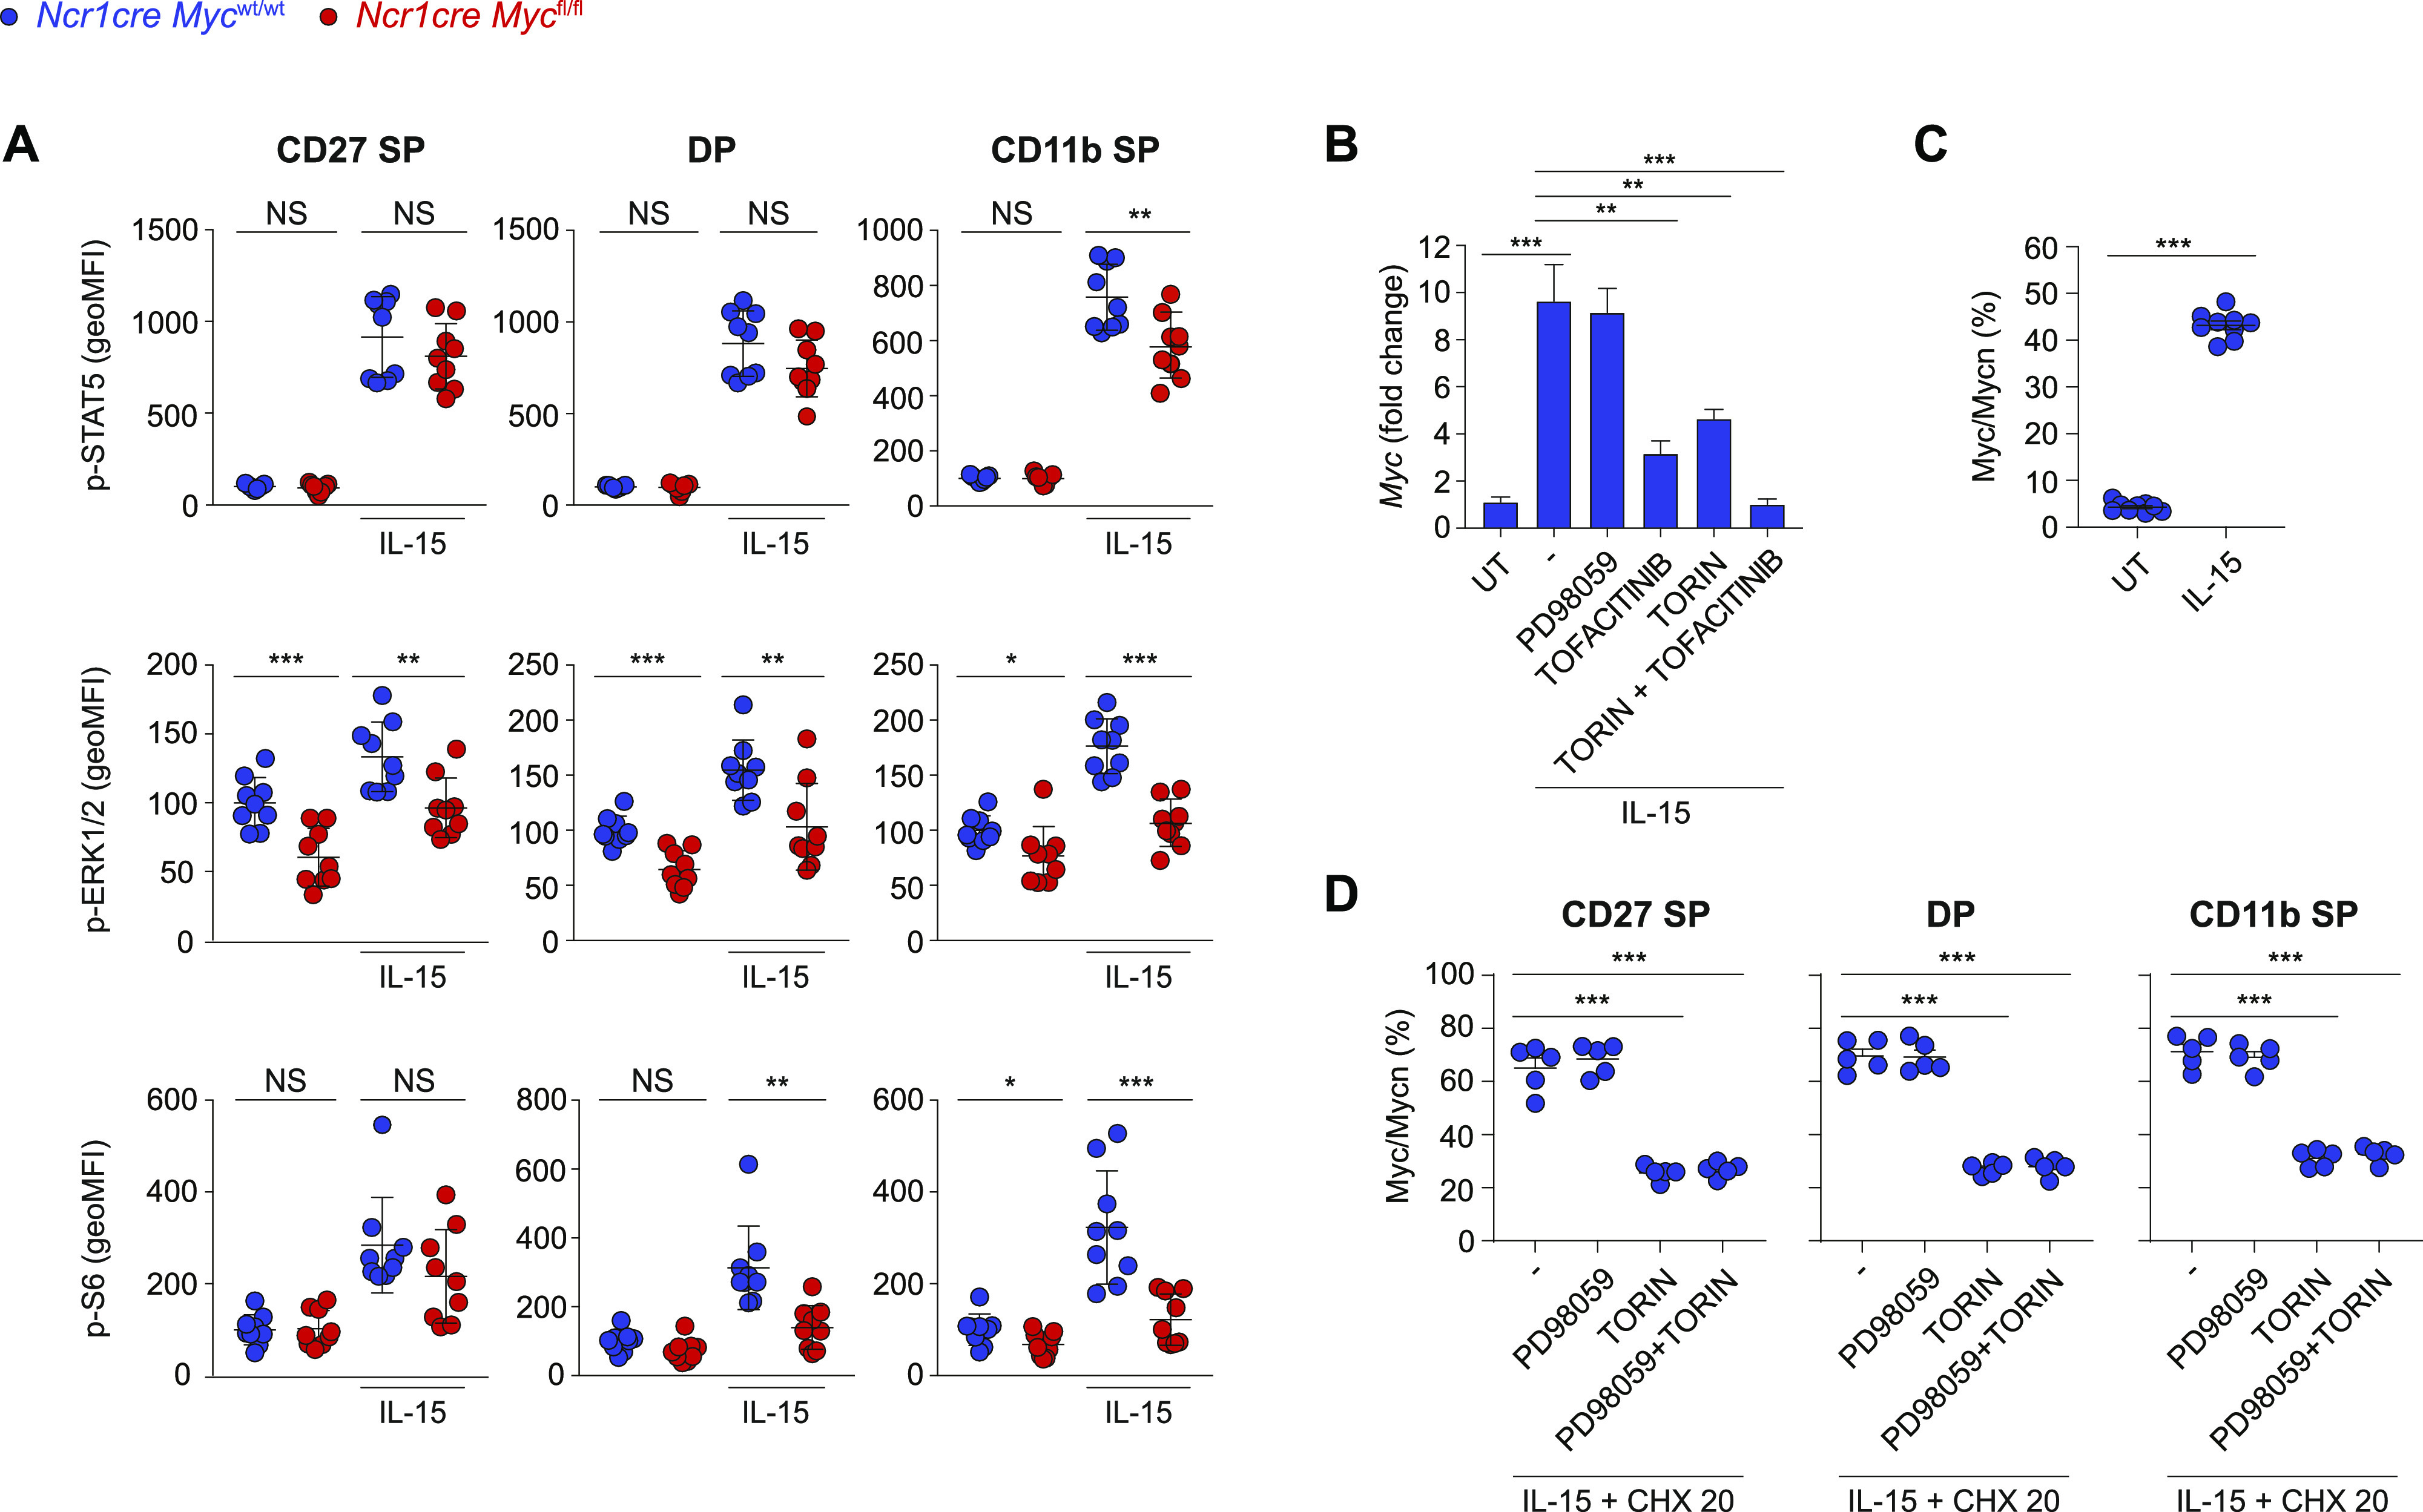
(A) Splenocytes from Ncr1cre Mycfl/fl and Ncr1cre Mycwt/wt mice were cultured in vitro for 40 min in the presence of 50 ng/ml IL-15 or left untreated. Phosphorylation of STAT5, ERK, and S6 were measured by flow cytometry in CD27 SP, DP, and CD11b SP NK cell subsets (CD122+, NK1.1+, and CD3/19−; the average of the unstimulated Ncr1cre Mycwt/wt was set as 100%). (B) qRT–PCR analysis (normalized to Polr2a/18 s) is shown for Myc mRNA in purified WT NK cells pretreated or not with Torin2 (250 nM), PD98059 (10 μM), tofacitinib (90 nM) or combinations thereof, and stimulated with 50 ng/ml of IL-15 for 2 h. (C) Splenocytes from control mice were stimulated with 50 ng/ml of IL-15 or left untreated for 2 h and the percentage of Myc/n-Myc-positive cells NK cells (NK1.1+CD3−) is shown. (D) Splenocytes from control mice were stimulated with 50 ng/ml of IL-15 for 2 h and then treated with cycloheximide (20 μg/ml), Torin2 (250 nM), and/or PD98059 (10 μM), as indicated. Graphs show the percentage reduction in Myc after 70 min (measured as geometric MFI) in the indicated NK cell subsets (NK1.1+). (A, B, C, D) Results depict mean ± SEM of n = 9 mice per genotype and are a pool of two experiments (A), mean ± SD of n = 3 technical replicates and are representative of at least two experiments (B), mean ± SD of n = 9 mice and are a pool of two independent experiments (C), mean ± SEM of n = 5 mice and are representative of two independent experiments (D). (A, C, D) Each symbol represents an individual mouse. (A, B, C, D) Statistical comparisons are shown; *P ≤ 0.05, **P ≤ 0.01, ***P ≤ 0.001, and NS, non-significant; t test, unpaired (A, B) or paired (C, D) and only statistically significant differences are shown (B, D).