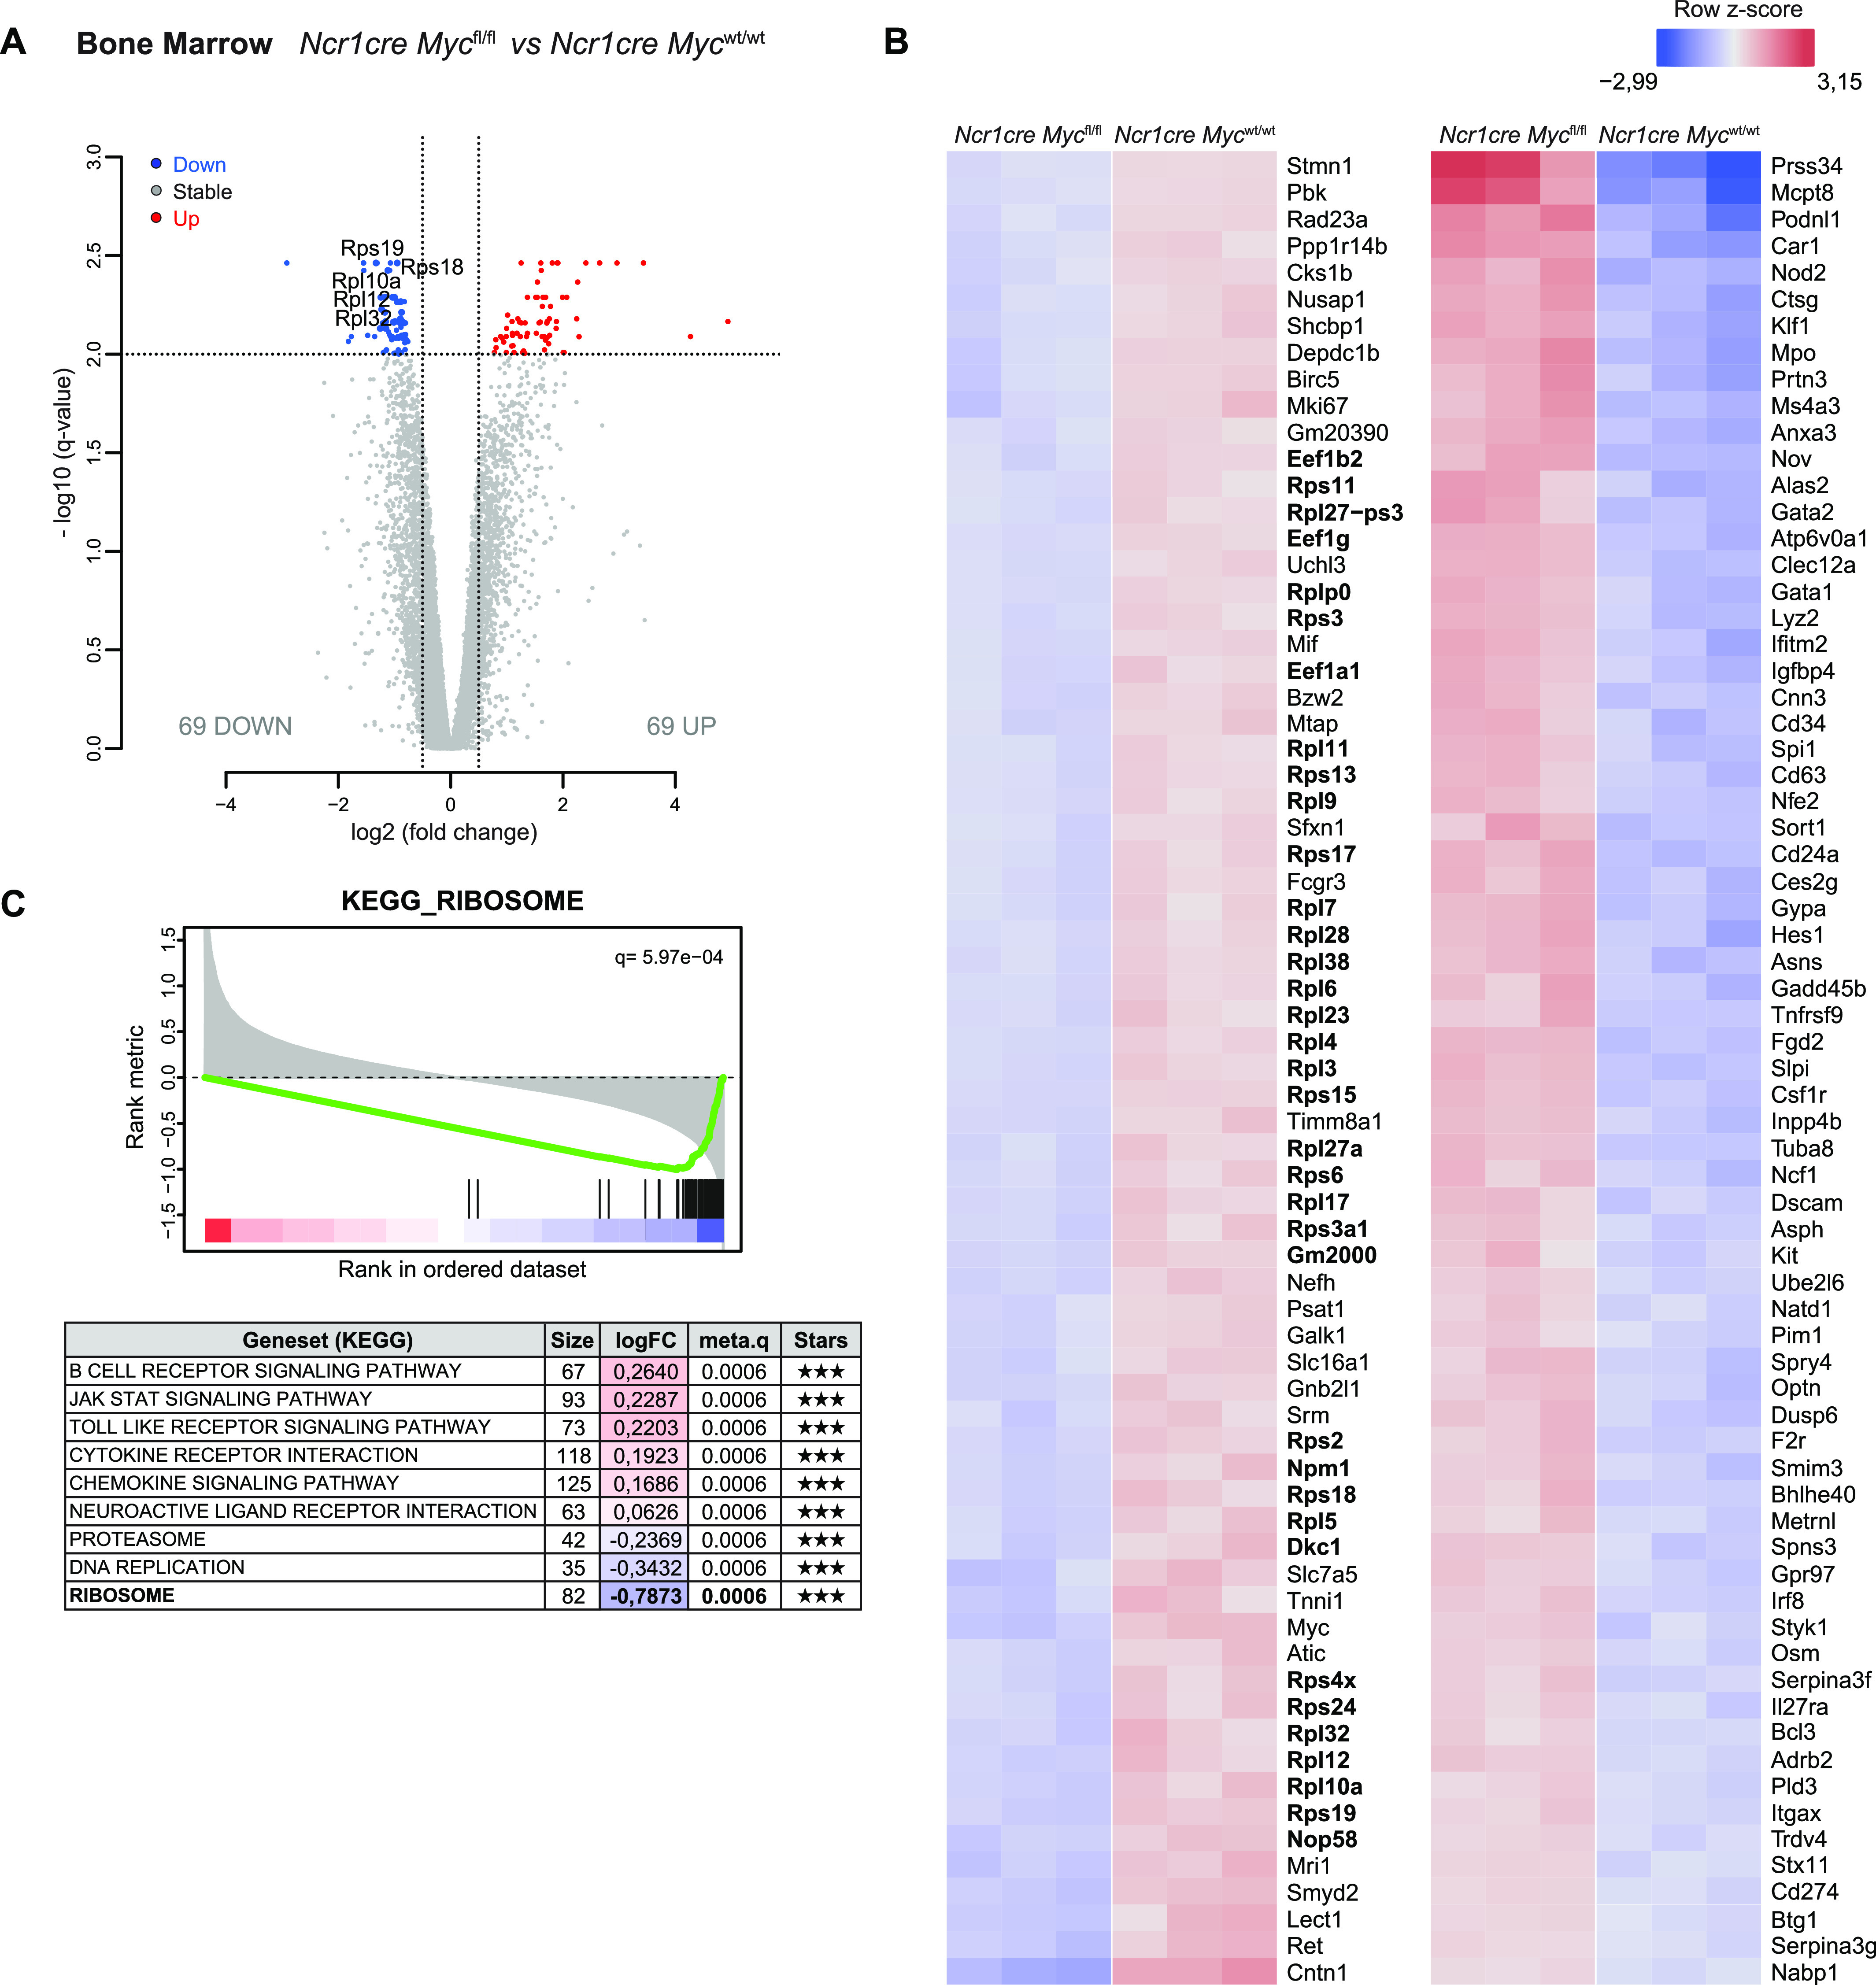
Figure 4. Myc-deficient NK cells present defective expression of genes related to translation.

(A, B, C) RNA sequencing analyses of CD27SP NK cells (sorted as NK1.1+CD27+CD11b−CD3/19−) harvested from the BM of Ncr1cre Mycfl/fl and Ncr1cre Mycwt/wt mice. (A) Volcano plot displaying differential expressed genes; the vertical axis (y-axis) displays the significance as the log10 (P-value), and the horizontal axis (x-axis) displays effect size as the log2 fold change value (FDR = 0.01; logFC threshold = 0.5; genes shown are significant for the three following statistical methods; DESeq2 [Wald test], edgeR, limma-trend). (B) Hierarchical clustering of the 138 significantly differentially expressed genes. (C) The table shows the top significant KEGG gene sets (q ≤ 0.0006 with fGSEA, fisher, and GSVA methods—indicated under Stars), their fold-change, and the number of genes in each. Enrichment plot for ribosome KEGG gene set is shown.
