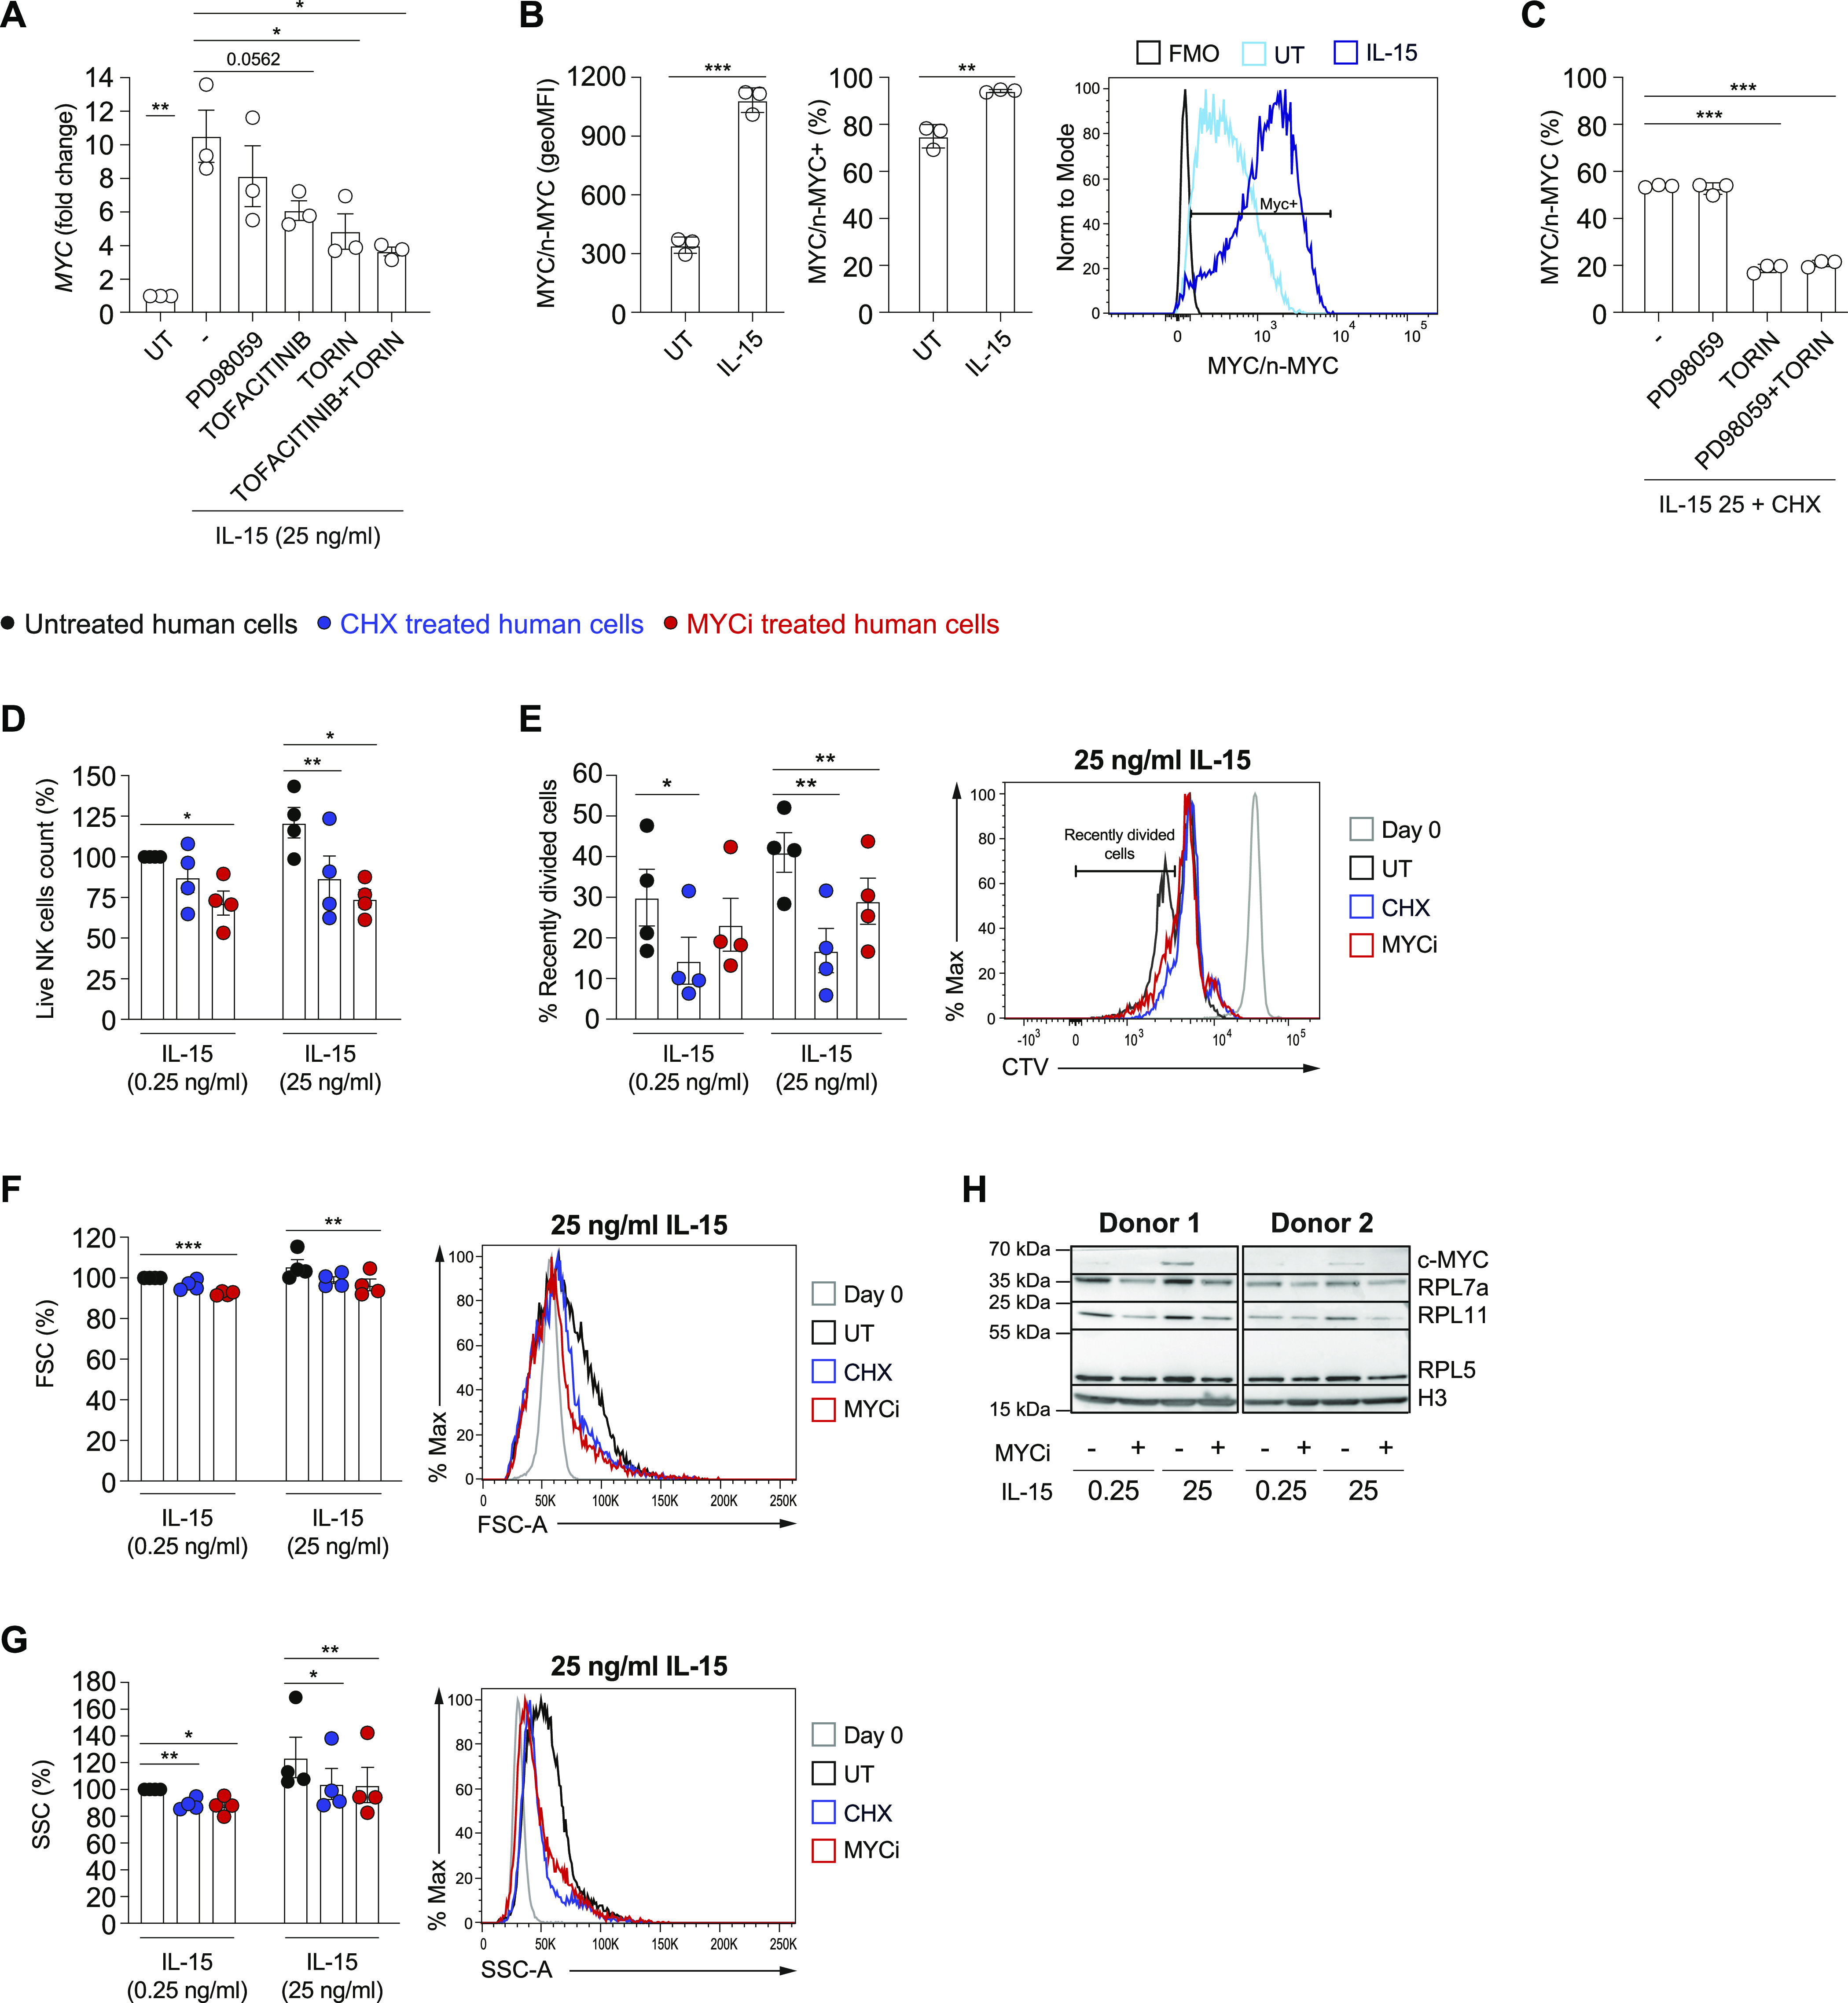
Figure 6. IL-15 up-regulates MYC and the translational machinery in human NK cells.

(A) qRT–PCR analysis (normalized to POLR2A) is shown for MYC mRNA in DERL7 cells pretreated (30 min) or not with Torin2 (250 nM), PD98059 (10 μM), tofacitinib (90 nM) or combinations thereof, and stimulated with 25 ng/ml of IL-15 for 2 h. (B) DERL7 cells were stimulated with 25 ng/ml of IL-15 or left untreated for 2 h and MYC expression levels were determined and expressed as geometric MFI and percentage positive; a representative histogram is shown. (C) DERL7 cells were stimulated with 25 ng/ml of IL-15 for 2 h and then treated with cycloheximide (20 μg/ml), Torin2 (250 nM), and/or PD98059 (10 μM), as indicated. Graphs show the percentage reduction in MYC after 70 min (measured as geometric MFI). (D, E, F, G) NK cells enriched from the blood of healthy human donors were stimulated with the indicated doses of IL-15. After an overnight period, 0.04 μg/ml of CHX or 20 μM MYC inhibitor 10058-F4 were added on a daily basis and the cells were cultured for further 3 d. NK cells were then analyzed by flow cytometry (CD56+CD3−). (D, E, F, G) Graphs show the percentage change in numbers of live NK cells (D), percentage of recently divided, and representative histogram overlay of CTV dilution (E), geometric mean and representative histogram overlays of FSC (F), and SSC (G) in the indicated condition. (H) The expressions of MYC and of ribosomal proteins RPL5, RPL7a, and RPL11 were assessed in cell lysates by Western blotting; Histone H3 was used as a loading control. (A, B, C, D, E, F, G) Results depict mean ± SEM of n = 3 biological replicates and are a pool of three independent experiments (A), mean ± SD of n = 3 technical replicates and are representative of two independent experiments (B, C), and mean ± SEM of n = 4 donors (D, E, F, G; the average of the condition treated with 0.25 ng/ml IL-15 only was set as 100%). (A, B, C, D, E, F, G) Statistical comparisons are shown; *P ≤ 0.05, **P ≤ 0.01, and ***P ≤ 0.001; t test, paired (A, D, E, F, G) or unpaired (B, C); only statistically significant differences are shown.
