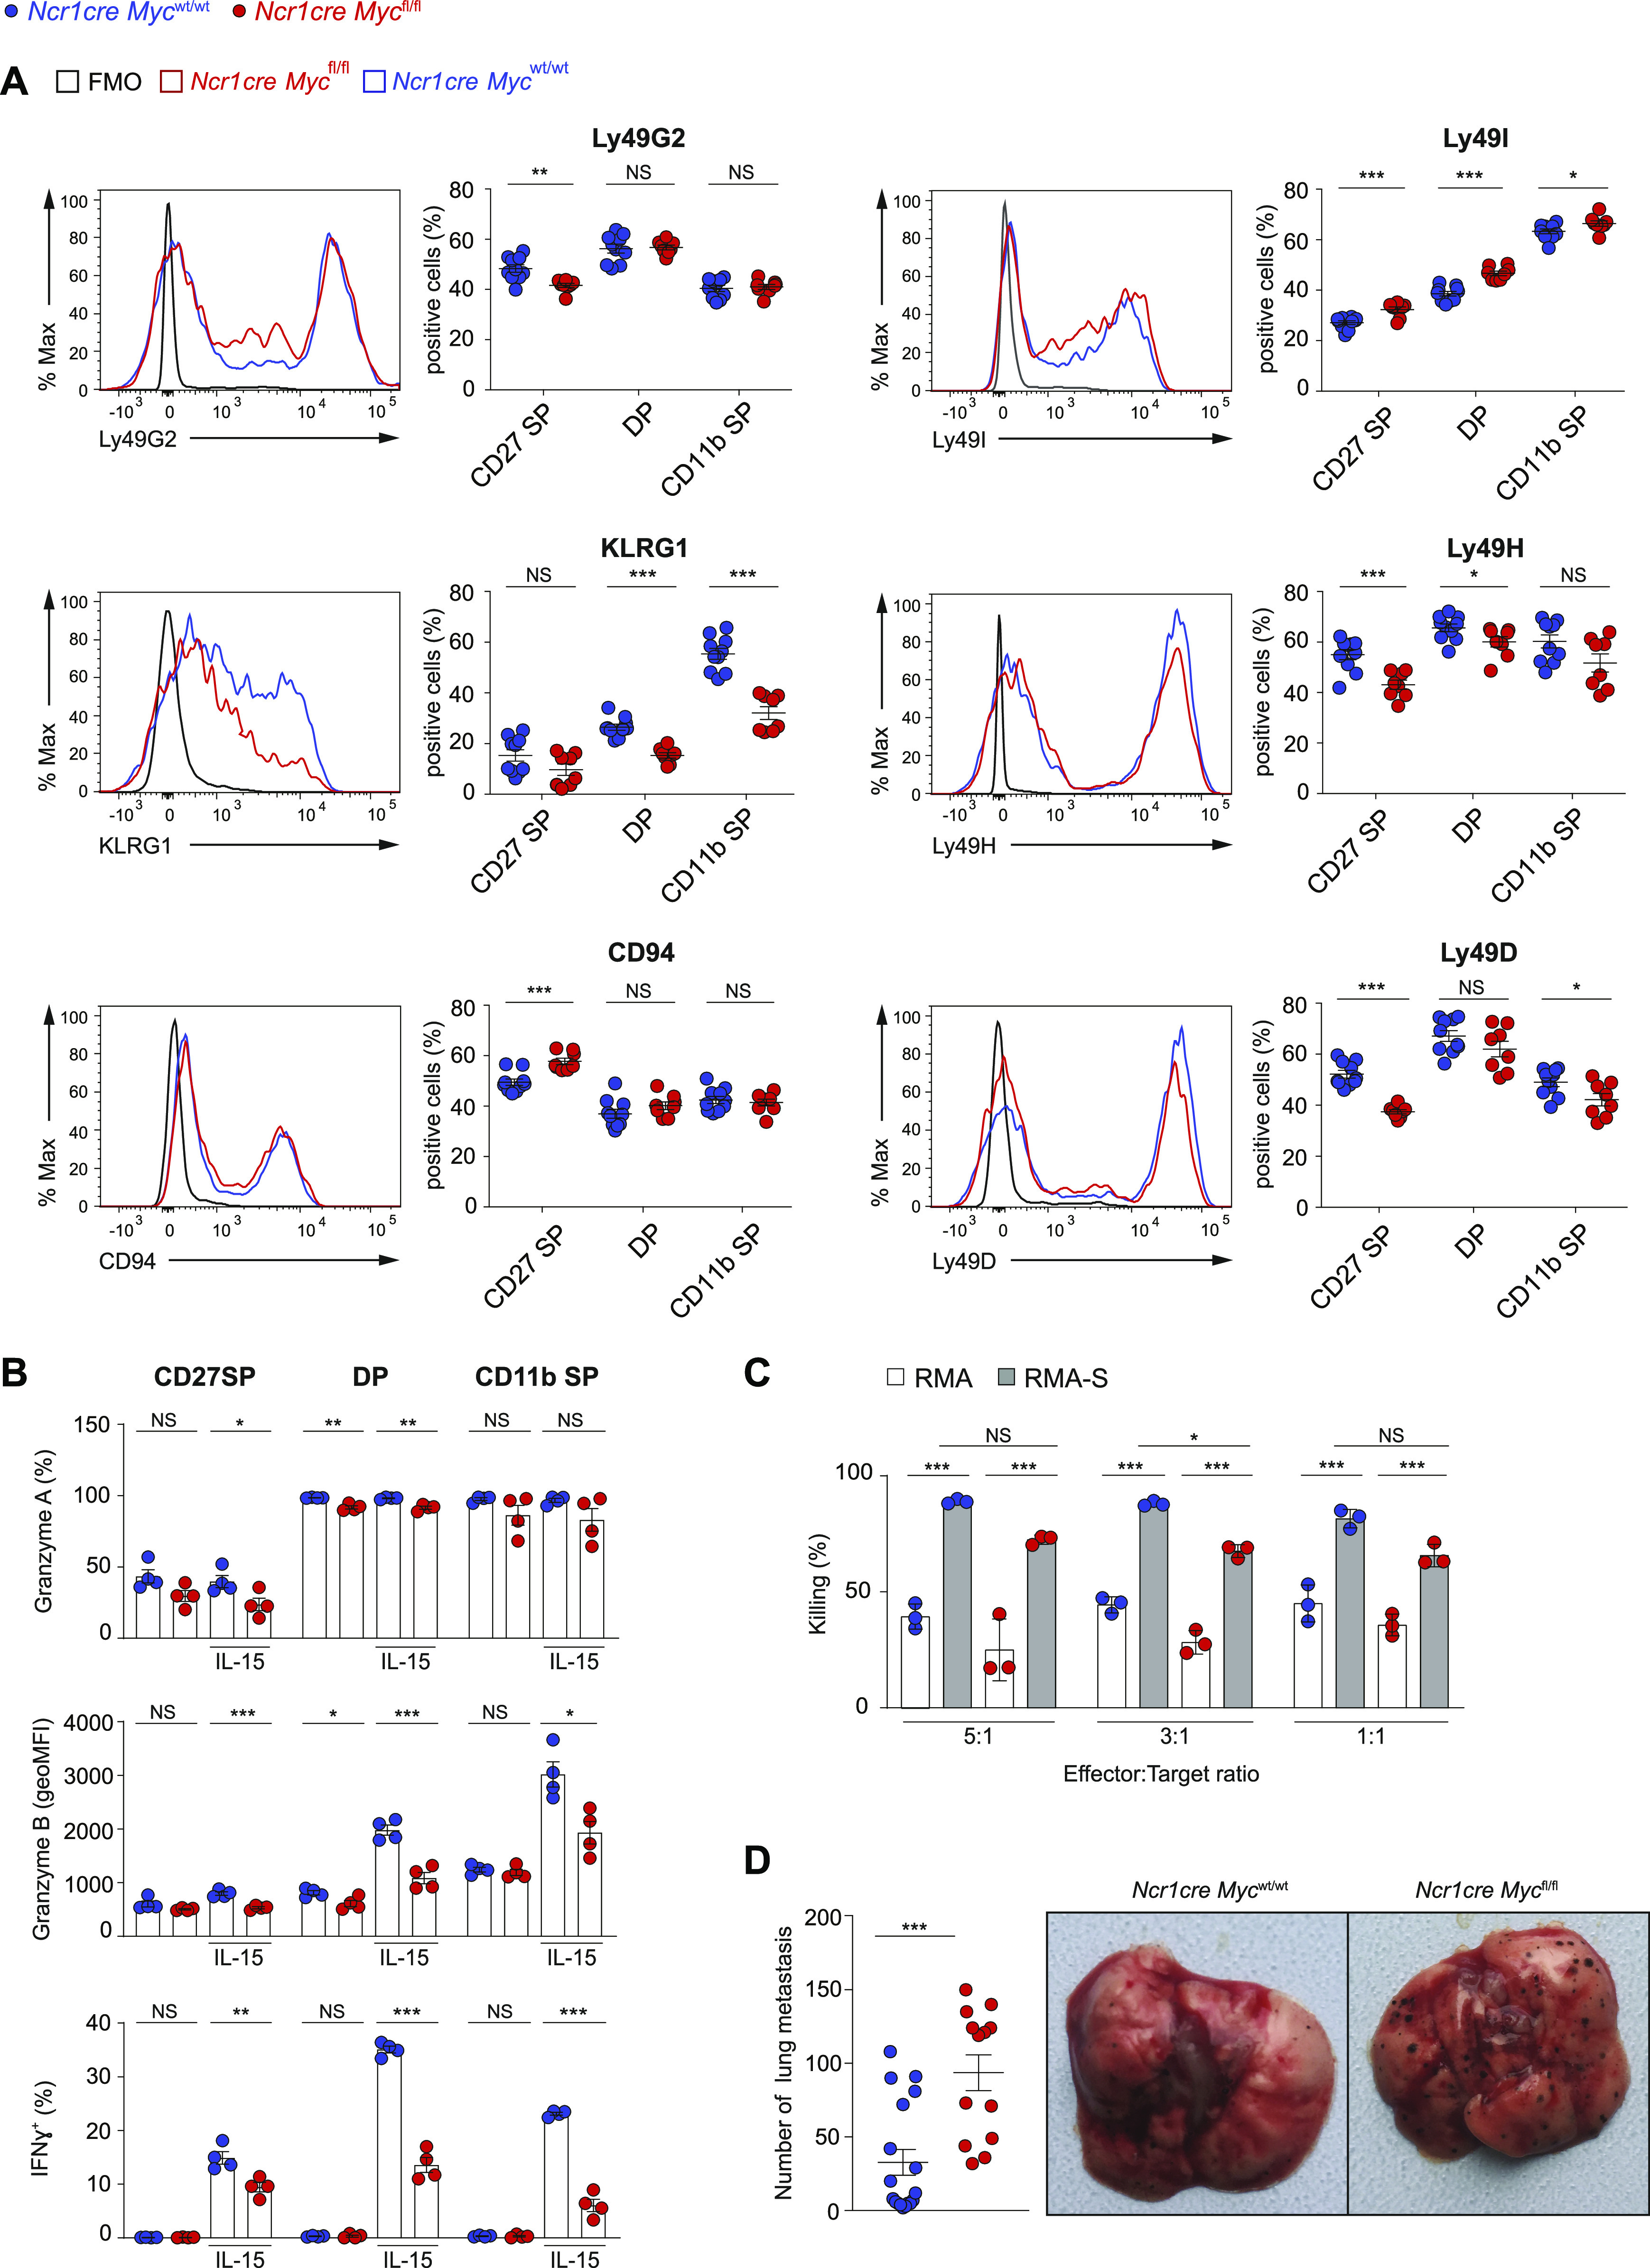
Figure 7. NK cell-intrinsic requirement of Myc for B16 control.

(A) The expression of the indicated receptors on splenic NK cells (NK1.1+CD3–CD19–) from Ncr1cre Mycfl/fl and Ncr1cre Mycwt/wt mice is depicted as representative flow cytometry histogram and as percentage positive population. (B) Graph illustrates the production of granzyme A, granzyme B, and IFN-γ by splenic NK cells (gated as NK1.1+CD3/CD19−) after stimulation with 50 ng/ml IL-15 for 4.5 h as measured by flow cytometry. (C) NK cells isolated from polyinosinic:polycytidylic acid (polyI:C)-treated Ncr1cre Mycfl/fl and Ncr1cre Mycwt/wt mice were plated with RMA or RMA-S cells at the indicated ratios. The graph depicts percentage killing of target cells, as measured by quantifying PI− living target cells after 4 h. (D) Quantification of nodules and a representative picture of the lungs at day 10 after intravenous injection of B16F10 melanoma. (A, B, D) Results illustrate mean ± SEM of n = 8–10 mice per genotype (A), of n = 4 mice per genotype (B), of n = 13–18 mice per genotype (D), and are a pool of two experiments (A, D) or are representative of at least two experiments (B). (A, B, D) Each symbol represents an individual mouse. (C) Results depict mean ± SD (n = 3 technical replicates) and are representative of at least two experiments. (A, B, C, D) Statistical comparisons are shown; *P ≤ 0.05, **P ≤ 0.01, ***P ≤ 0.001, and NS, non-significant; t test, unpaired (A, B, D) and two-way ANOVA (C).
