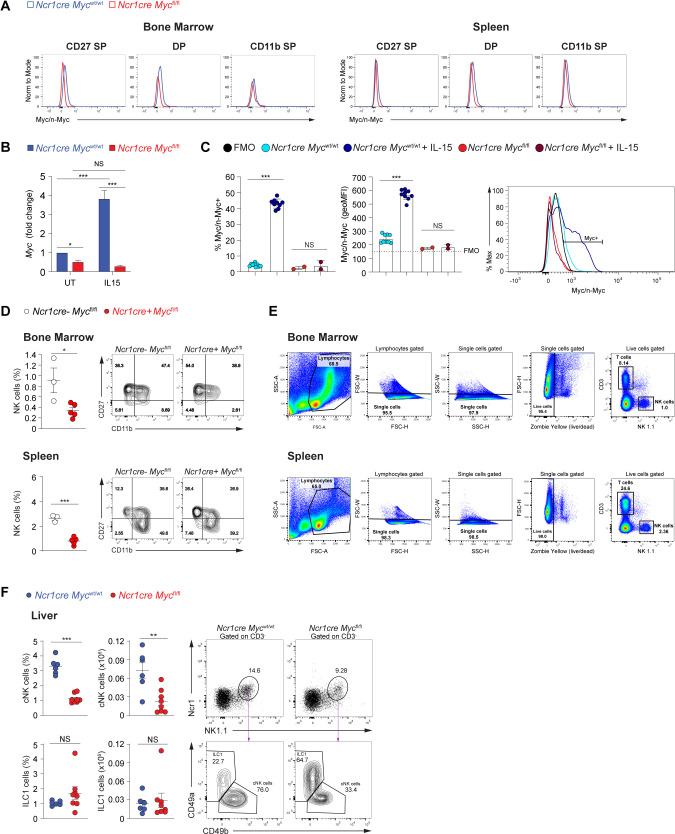
Figure S1. Deletion of Myc in NK cells.
(A) Representative histogram overlays showing Myc expression levels in the respective NK cell subsets in the BM and spleen. (B) The graph shows Myc transcript in enriched splenic NK cells from Ncr1cre Mycwt/wt and Ncr1cre Mycfl/fl mice stimulated for 2 h with 50 ng/ml IL-15 or left untreated. Values (normalized to Polr2a) are shown as fold change versus untreated control at 2 h. (C) Flow cytometry staining for Myc/n-Myc in splenic NK cells enriched from Ncr1cre Mycwt/wt (WT) and Ncr1cre Mycfl/fl (KO) mice stimulated or not with 50 ng/ml of IL-15 for 2 h. Geometric MFI values and percentage of Myc-positive cells are shown. Representative histogram overlay is shown on the right panel; the black histogram shows the fluorescence minus one of PE of NK cells stained with all markers of interest except for PE Myc/n-Myc and was used as a negative control. (D) Percentages of NK cells (NK1.1+Ncr1+CD3−) in the BM and spleen and representative flow cytometry plots of CD27 SP, DP, and CD11b SP NK cell populations of Ncr1cre-negative Mycfl/fl and Ncr1cre Mycfl/fl mice are shown. (E) Representative gating strategy to identify NK cells in the BM and spleen is shown. (F) Percentage, number, and a representative flow cytometry plot of conventional NK cells (cNKs; NK1.1+Ncr1+CD49b+CD3−) and ILC1s (NK1.1+Ncr1+CD49a+CD3−) in the liver of the indicated mice are shown. (B, C, D, F) Results are mean ± SD of three technical replicates (B), mean ± SEM of n = 10 Ncr1cre Mycwt/wt and n = 2 Ncr1cre Mycfl/fl (C), n = 3–5 (D), n = 6–8 (F) mice per condition and are a pool of two experiments (C, F). (B, C, D, F) Statistical comparisons are shown; *P ≤ 0.05, **P ≤ 0.01, ***P ≤ 0.001, and NS, non-significant; Two-way ANOVA (B) and t test, non-paired (C, D, F).

