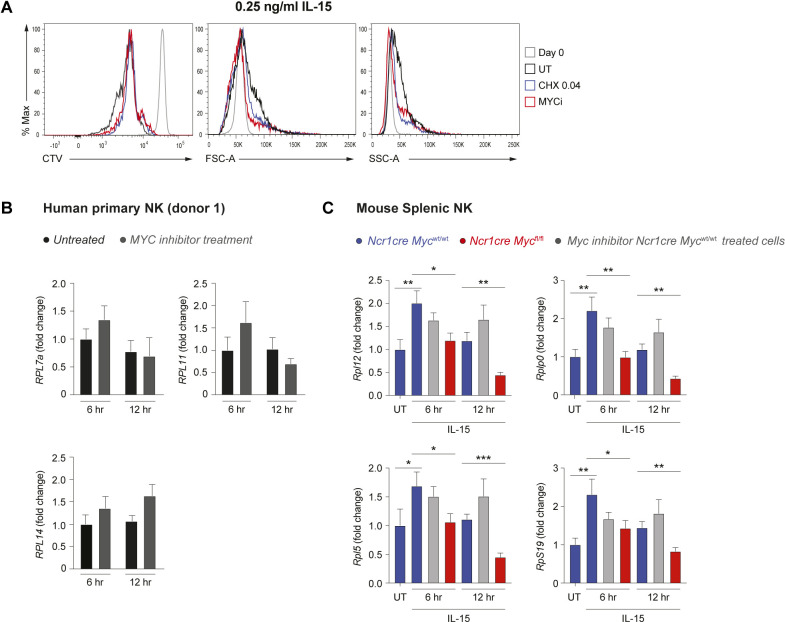
Figure S4. Differences between genetic Myc ablation and inhibition using 10058-F4.
(A) As in Fig 6E–G, representative histogram overlays of CTV dilution, FSC, and SSC are shown. (B) NK cells enriched from the blood of a healthy human donor were stimulated with 25 ng/ml IL-15 and 20 μM MYC inhibitor 10058-F4 overnight; then, a second dose of 20 μM MYC inhibitor 10058-F4 was added and cells were cultured for further 6–12 h mRNA expression of RPL7A, RPL11, and RPL14 was determined by qRT–PCR. Values (normalized to POLR2A, UBE2D2, and HPRT) are shown as fold-change versus untreated 6 h. (C) Control or Myc-deficient enriched splenic NK cells were stimulated overnight with 50 ng/ml IL-15 overnight and treated or not with 20 μM Myc inhibitor 10058-F4. Then, a second dose of 20 μM Myc inhibitor 10058-F4 was added or not, and cells were cultured for further 6 or 12 h, as indicated. mRNA expression of Rplp0, Rpl12, Rpl5, and Rps19 was determined by qRT–PCR. Values (normalized to Polr2a, 18 s, Gapdh, and Hprt) are shown as fold change versus freshly isolated untreated (UT) control cells. (B, C) Results depict mean ± SD of n = 2 (B) and n = 3 technical replicates (C), and are representative of two independent experiments. (B, C) Only statistically significant differences compared with the untreated controls (C) and with the respective 6 h and 12 h Ncr1cre Mycwt/wt control are shown; *P ≤ 0.05, **P ≤ 0.01, and ***P ≤ 0.001; t test, unpaired (C).

