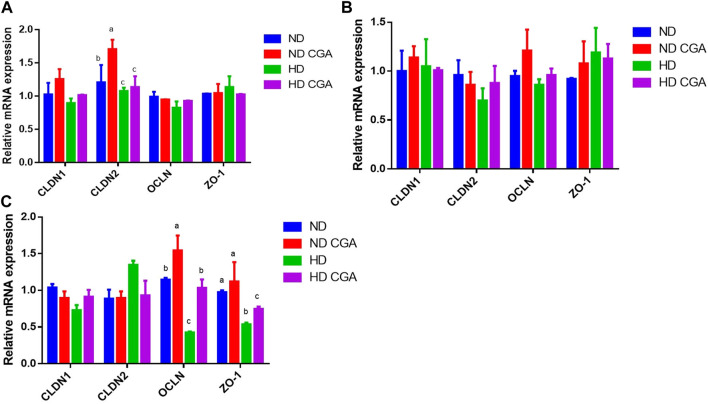
FIGURE 2.
Effects of CGA on ileum mRNA expression of tight junction genes in broilers under HD stress. ND group, normal stocking density + basal diet; ND + CGA group, normal stocking density + basal diet +0.15% CGA; HD group, high stocking density + basal diet; HD + CGA group, high stocking density + basal diet +0.15% CGA. (A) Relative mRNA expression at day 28. (B) Relative mRNA expression at day 35. (C) Relative mRNA expression at day 42. Each vertical bar represents the mean ± SEM (n = 10). Values with different letters within the same row are indicative of statistically significant differences (p < 0.05, Tukey’s HSD test after one-way ANOVA).

