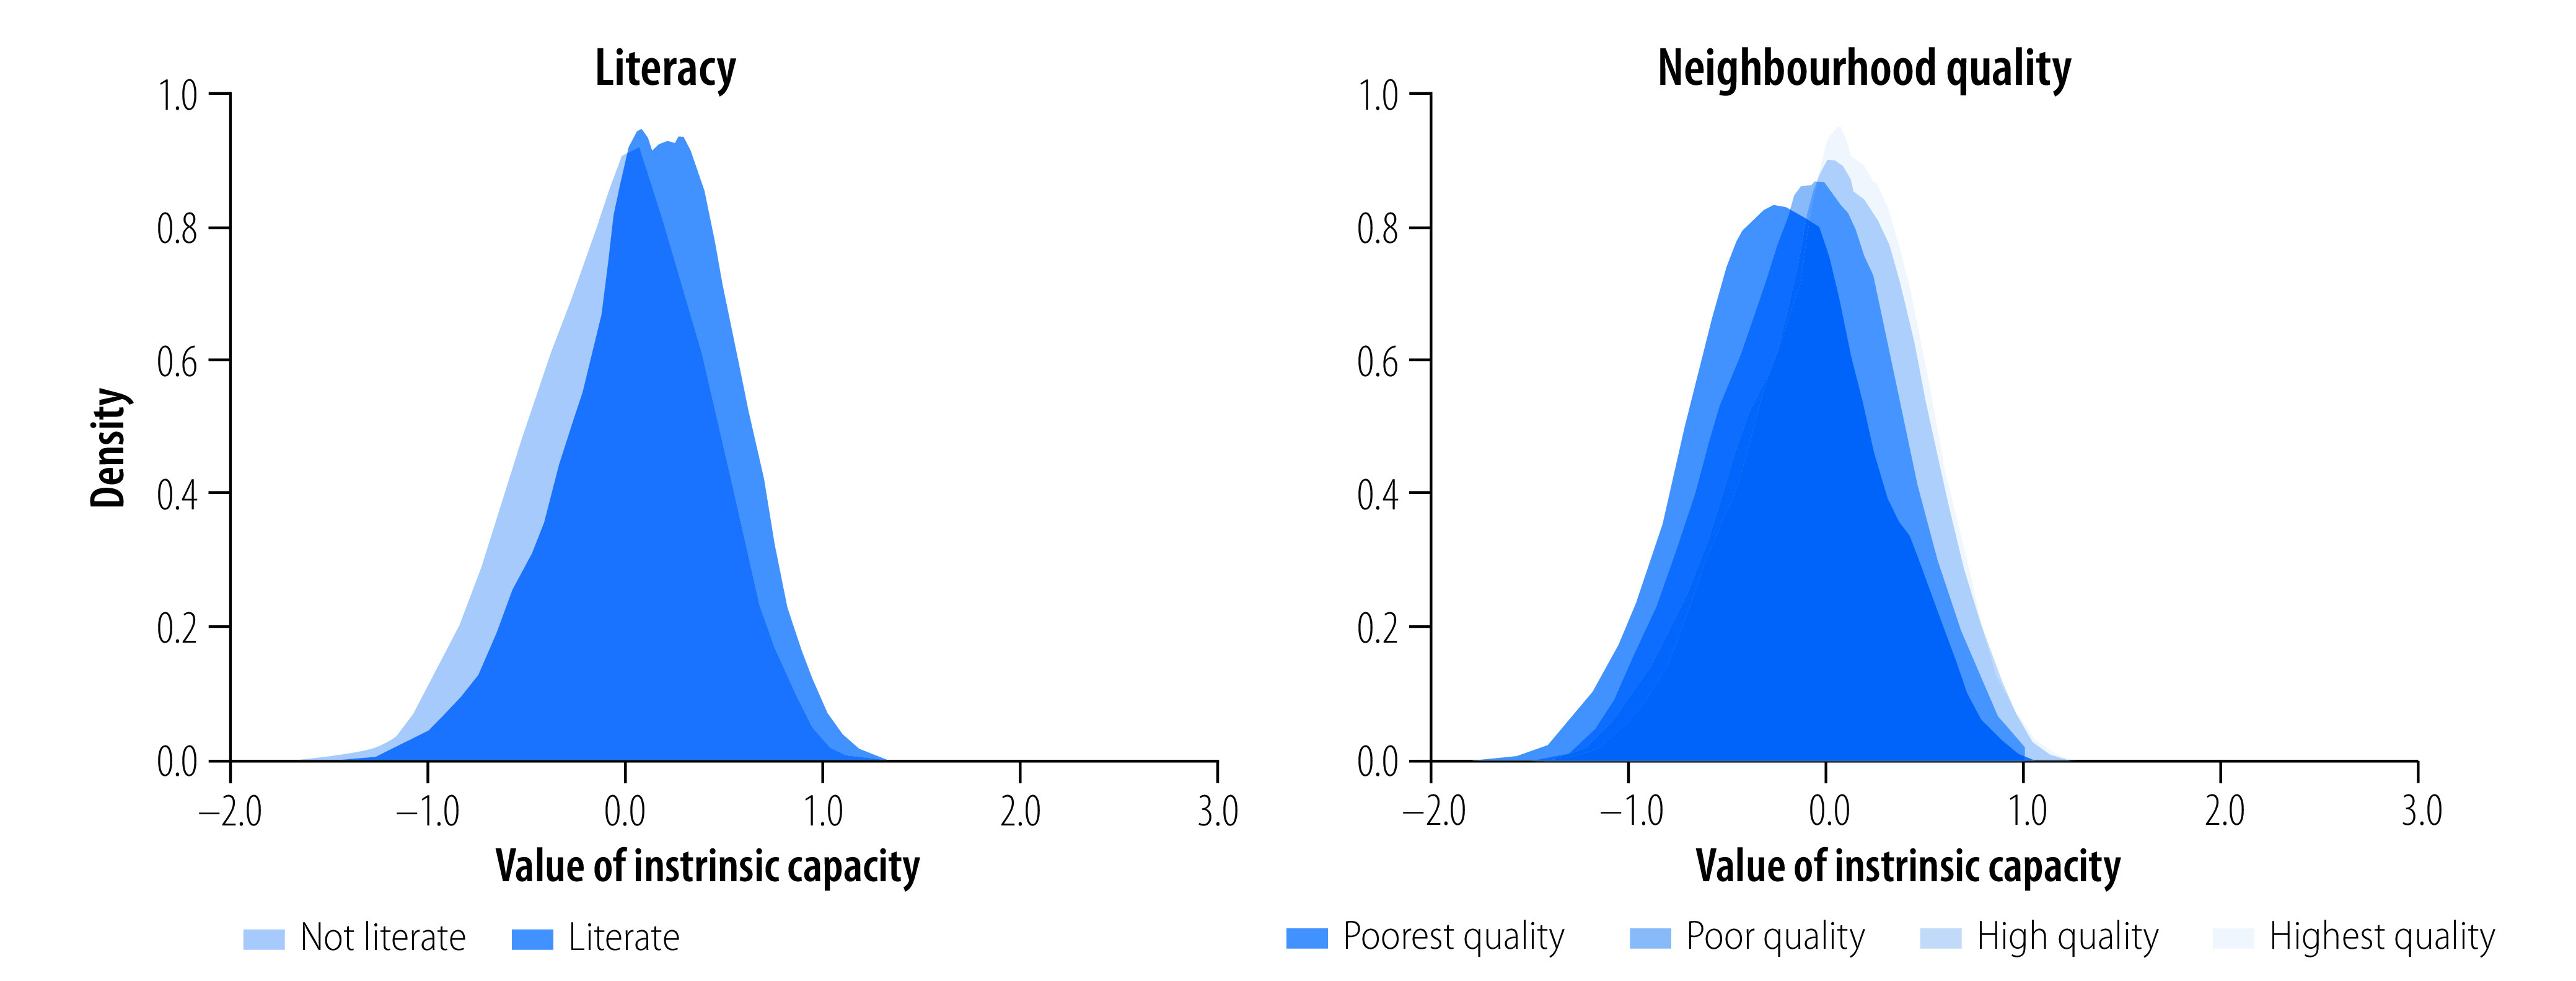
Fig. 1.
Distribution of intrinsic capacity and the association of life-course factors, China, 2011–2013
Notes: We included 21 783 participants from the CHARLS study, waves 1 and 2. The plot shows Kernel density distribution of intrinsic capacity. Neighbourhood quality was assessed by four questions asking participants whether the neighbourhood where they lived as a child was safe, willing to help, close-knit, and clean and attractive. Each measure was dichotomised as low (not very or not at all) and high (somewhat or very) leading to a sum measure of adversity ranging from 0 (lowest) to 4 (highest).

