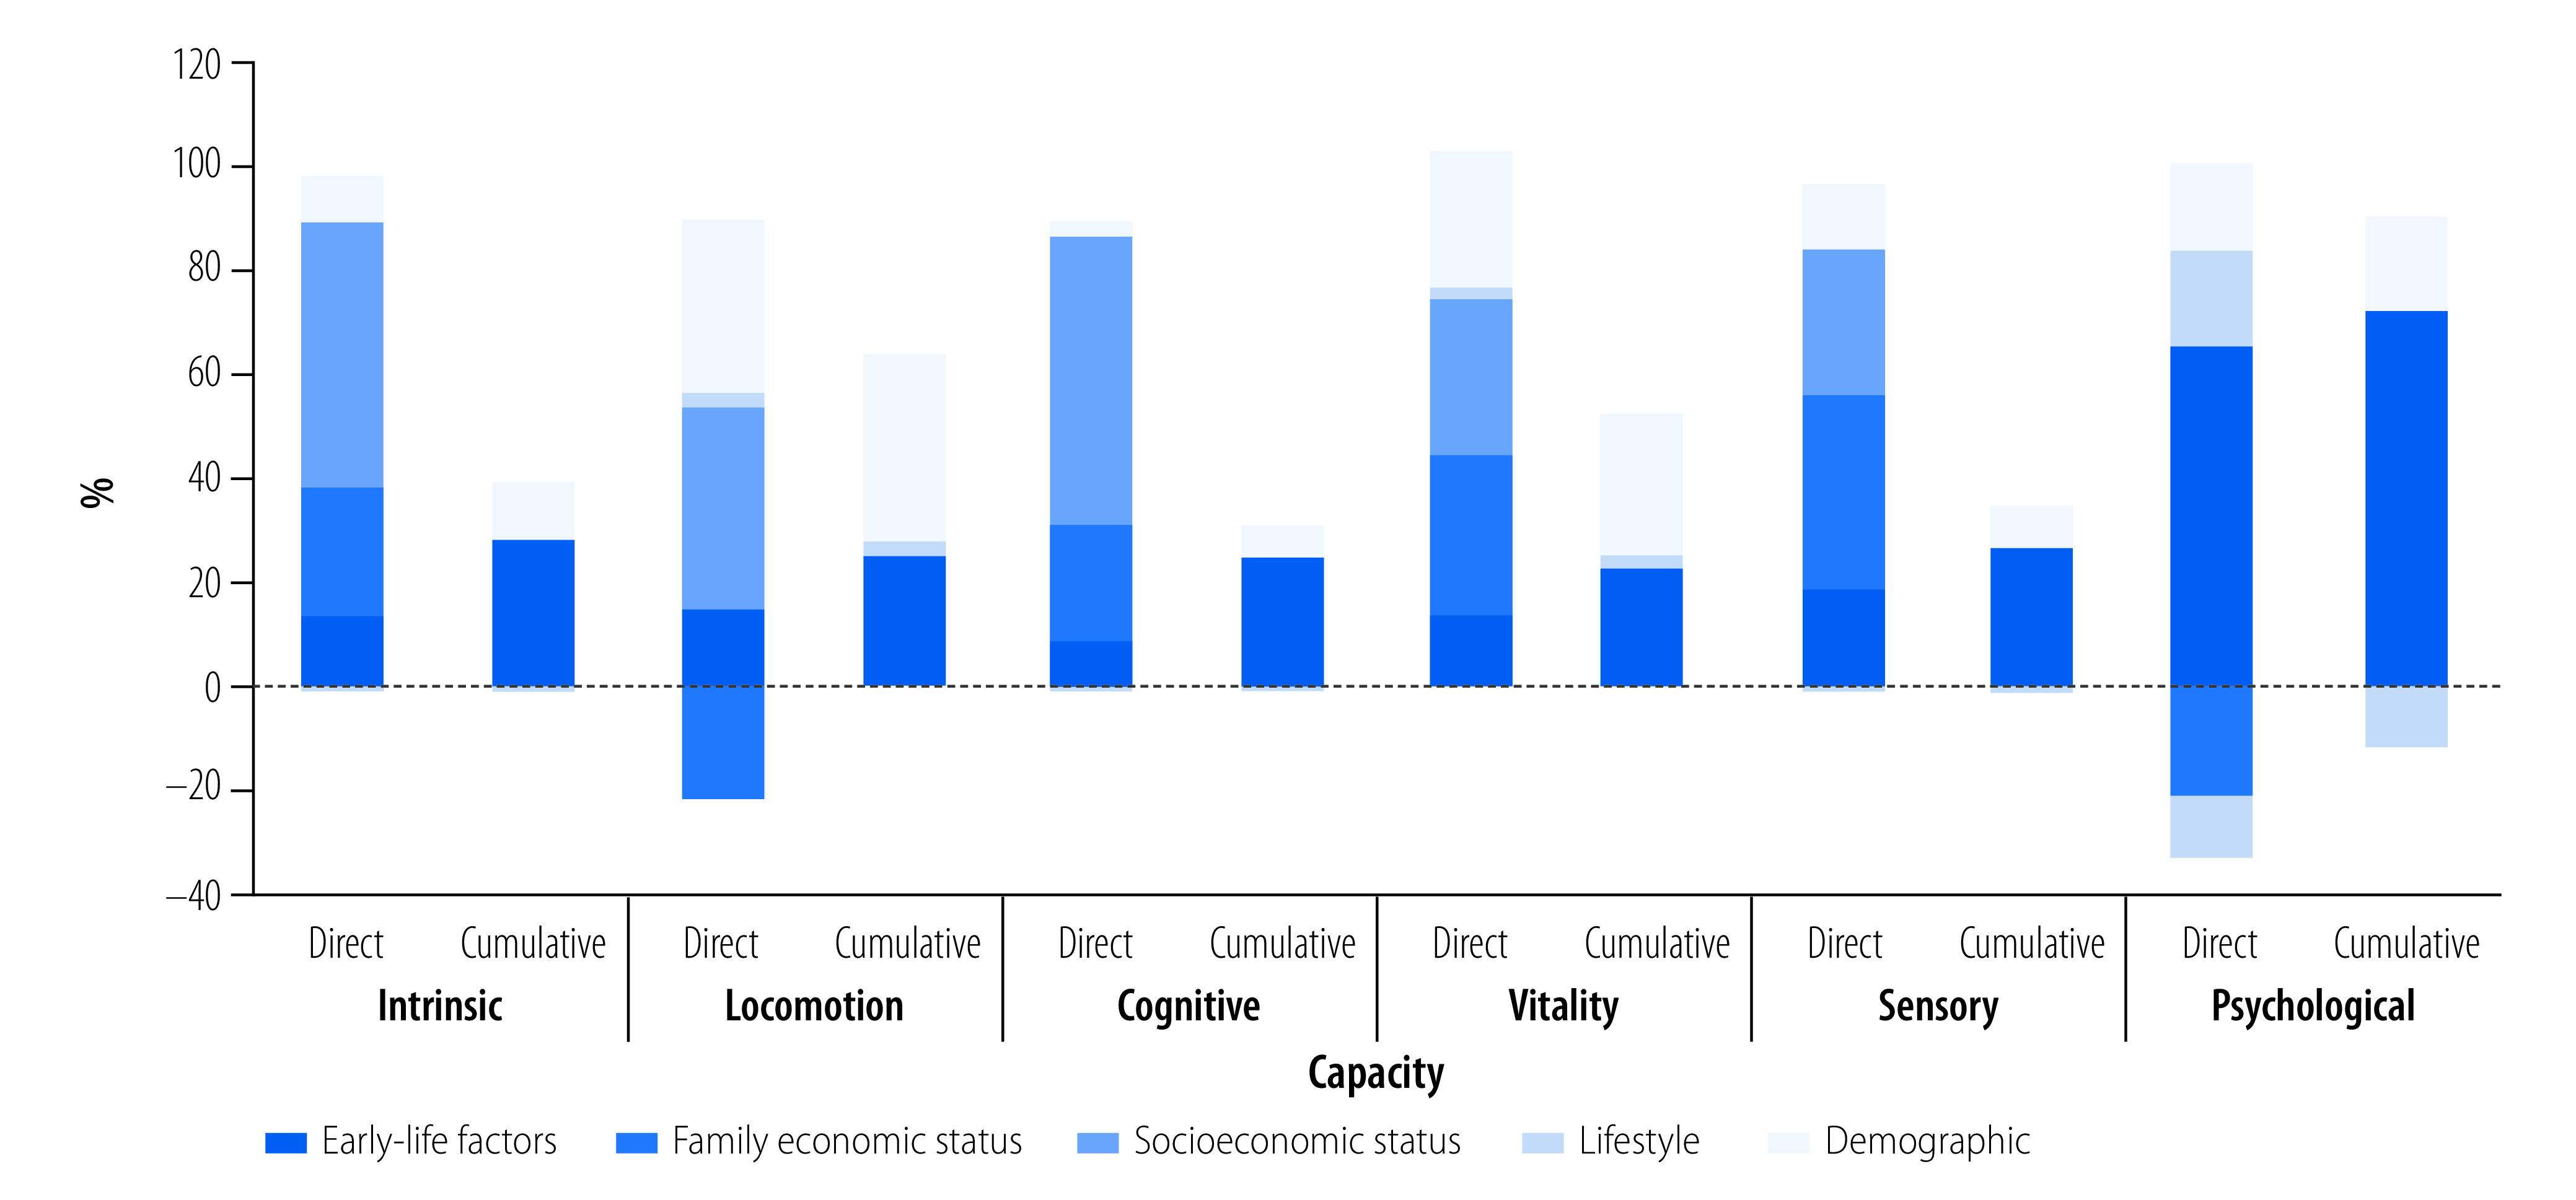
Fig. 5.
Decomposing the life-course inequalities in intrinsic capacity, China, 2011–2013
Notes: We included 21 783 participants from the CHARLS study, waves 1 and 2. The percentages show the contribution of each category factor to the overall intrinsic capacity inequalities by decomposing the modified concentration index. For bars showing direct contributions, all life course factors were included, and thus the graph shows the direct contribution of early-life factors to inequalities in intrinsic capacity. For bars showing cumulative contributions, current socioeconomic position was excluded from the model of mediation analysis, and thus the graph shows the cumulative contribution of early-life factors to inequalities in intrinsic capacity. Current socioeconomic position excludes the family economic status factor. Theoretically, the contribution of observable determinants to inequalities in intrinsic capacity can be more than 100% since the contribution of the error term is not included and can be negative. Further details are available in the online repository.25

