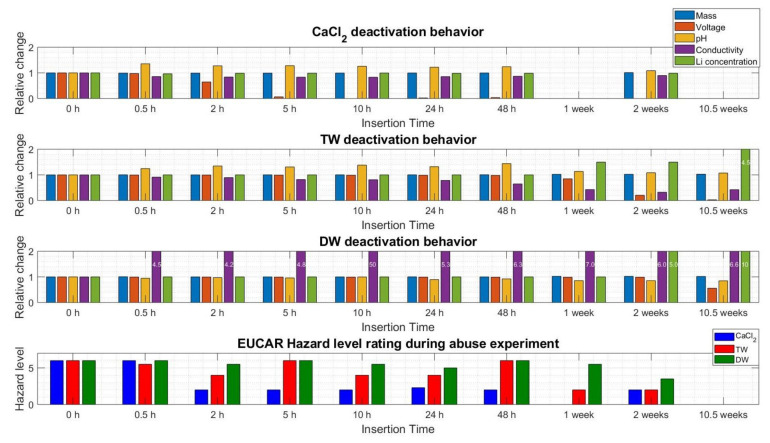
Figure 21.
Overview of the relative change of the various parameters recorded during the experiments with all follow-up values displayed in relation to the initial values; the last row displays the change in the EUCAR hazard-rating scheme in absolute numbers; all values depict the average for that condition.

