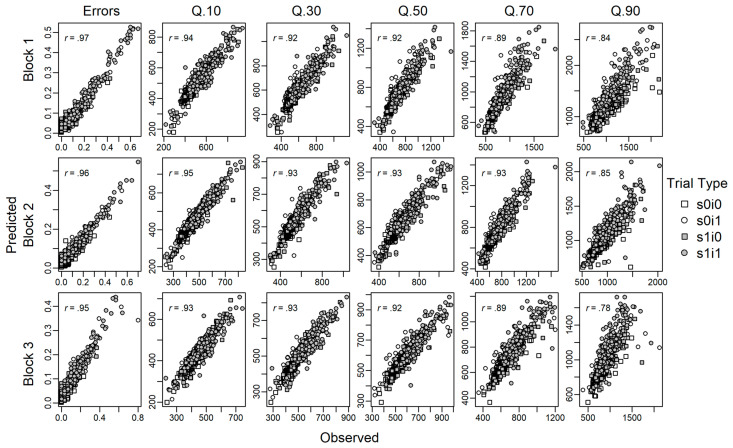
Figure A2.
Scatterplot of observed and model-predicted proportion of errors and quantiles of correct responses (in milliseconds) for participants in the respective trial types, as defined by task repeat vs. task-switch (s0; s1) trials with response–congruent vs. incongruent (i0; i1) stimulus attributes.

