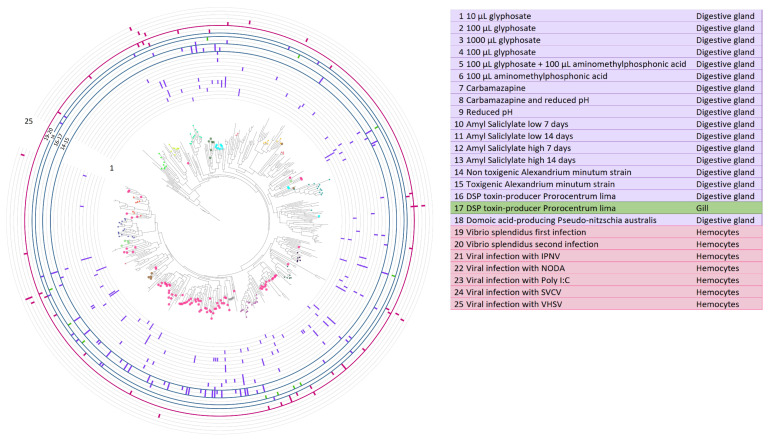
Figure 5.
Modulation of specific mussel CTL genes with different transcriptomic stimuli. The phylogenetic tree of Mytilus galloprovincialis CTLs is included along stacked histograms indicating the modulation (p value < 0.05) of specific CTLs with different transcriptomic stimuli (Supplementary File S3).

