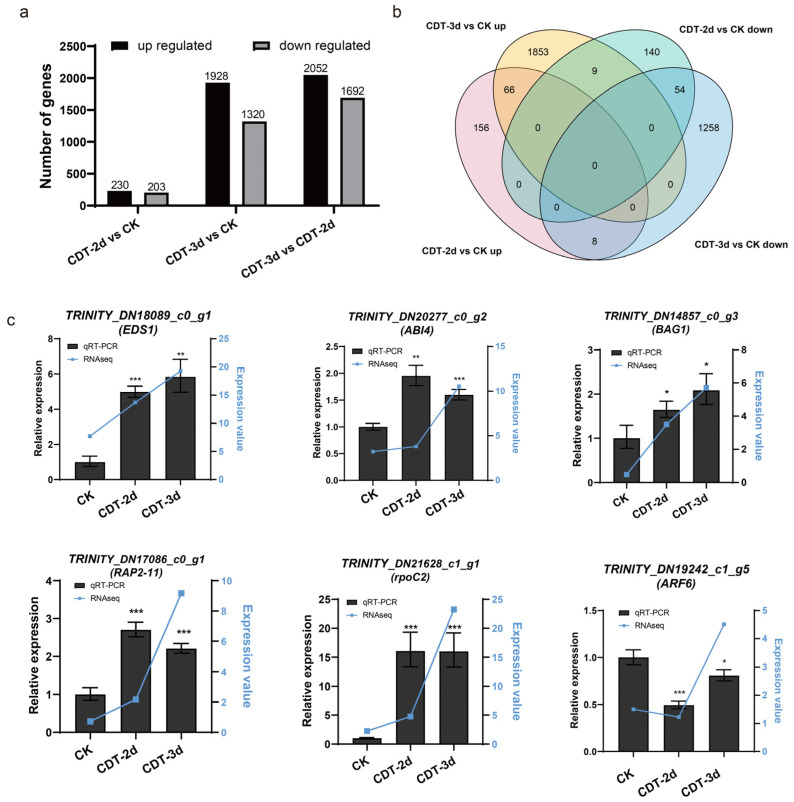
Figure 3.
Differentially expressed genes (DEGs) during seed aging in transcriptome and expression verification by qRT−PCR. CK, control check; CDT−2d, seeds aged for two days; CDT−3d, seeds aged for three days. (a) The bar chart shows the number of up−regulated and down−regulated DEGs in comparison to the three libraries, with FDR ≤ 0.05, and|log2FC| ≥ 1 as the threshold. (b) Venn diagrams show the number of genes up and down−regulated during the aging of elm seeds. (c) The comparison of qRT−PCR and sequencing results of six genes. The actin of elm was used as an internal reference. All reactions were repeated three times. Error bars indicate the standard deviation of three replicates. *, p < 0.05; **, p < 0.01; ***, p < 0.001. The expression data by transcriptome sequencing are shown by the broken blue line for the sake of comparison.

