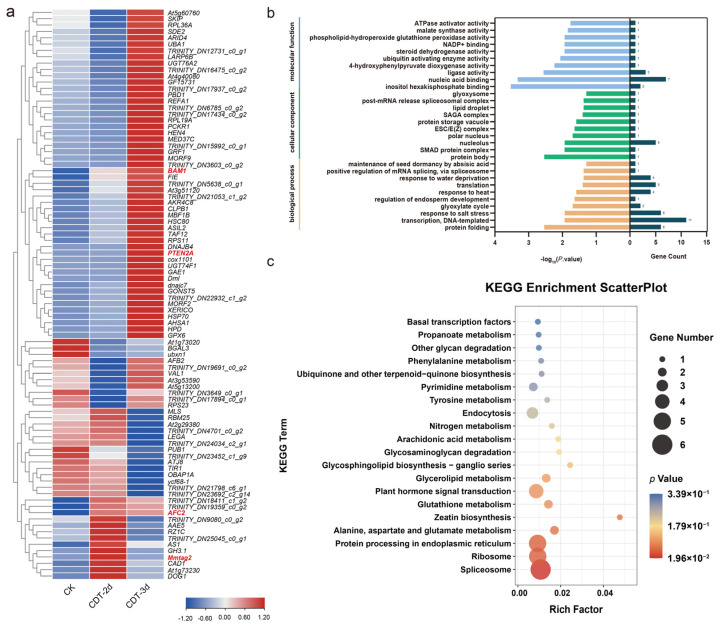
Figure 4.
Overview of identified target genes of DEMs by degradome sequencing. (a) Expression profile of target genes of DEMs. CK, control check; CDT−2d, seeds aged for two days; CDT−3d, seeds aged for three days. The genes further analyzed by experimental approaches are highlighted in red. The blue−red bar at the bottom right of the heat map indicates the relative expression intensities. The darker the red color, the higher the expression, while the darker the blue color, the lower the expression. The expression pattern diagrams of miRNAs were plotted using TBtools v1.108. (b) The top 10 GO terms with the lowest p value were enriched for mapping. The ordinate is the GO entry, the left abscissa is the −log10 p value of the enrichment analysis, and the right abscissa is the gene number. (c) KEGG enrichment analysis for target genes of DEMs.

