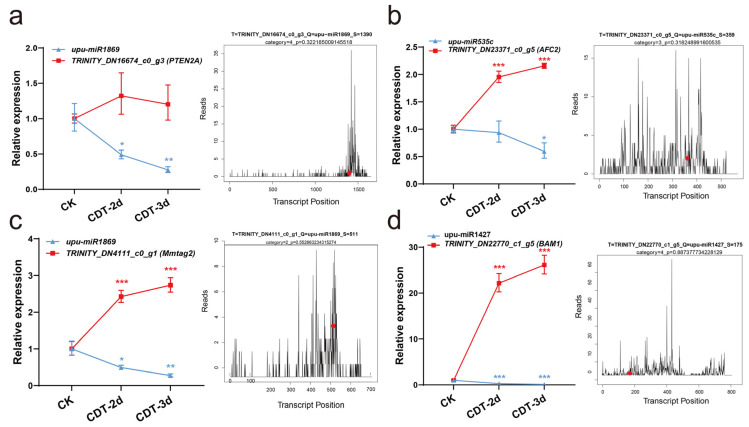
Figure 5.
The validation of miRNA cleavage predicted target genes by qRT−PCR. CK, control check; CDT−2d, seeds aged for two days; CDT−3d, seeds aged for three days. (a–d) MiRNA−target genes confirmed by qRT−PCR (left panel) and target plots (t−plots) of degradome sequencing (right panel). The T−plots diagram shows the full−length distribution of the degradome tags along the target gene sequence. The vertical line with red point indicates the cleavage site of each transcript. Error bars indicate the standard deviation of three replicates. *, p < 0.05; **, p < 0.01; ***, p < 0.001.

